Tuesday, December 05, 2006

Dancing On The Bottom

Today Toll Brothers released its “Fourth Quarter and FYE 2006 Earnings Results” report outlining both the dramatic drop-off in contract activity and income in 2006 as well as projecting a truly dismal future for 2007.

Particularly notable was the $92.7 million in after tax land write-downs to owned or optioned lots, a 94.5% increase compared to 2005.

Toll Brothers divested itself of some 17,200 lots in 2006 leaving them owning or controlling through options roughly 74,000 lots, a 19% reduction from the peak of 91,200 lots.

Worst of all though was Toll’s profound projections for a 50.5% - 60% decline in net income as well as a 17% - 29% fall-off in total revenues for 2007.

Additionally, Toll stated that they will budget an additional $60 million for land-write downs during 2007.

In the release CEO Robert Toll suggests the following:

“Fifteen months into the current slowdown, we may be seeing a floor in some markets where deposits and traffic, although erratic from week to week, seem to be dancing on the bottom or slightly above. The metro D.C. suburbs of northern Virginia, which was the first market in which we saw activity slow, seems to have stabilized, although at levels much lower than those we have enjoyed over the past few years. In metro DC’s Maryland market, a more lot-constrained region where builders built fewer spec homes and there were fewer speculative buyers, the market also appears to be stabilizing.”

Right now is a great time to buy a new luxury home. Builders are motivated to sell their specs and the fundamentals that typically lead our industry out of a slowdown are already in place. Interest rates are near historic lows, unemployment is near an all-time low and the stock market is setting records.”

Although less than 30 days ago, this was Bob Toll’s sentiment:

“We continue to look for signs that a recovery is imminent but can’t yet say that one is in sight.”

Here are some of the interesting data points from today’s release:

Full Year Results

  • Net income was $687.2 million down 14.75% as compared to 2005
  • $92.7 million in after tax land write-downs up 94.5% as compared to 2005
  • EPS declined 13% as compared to 2005
  • Total revenues were $6.12 billion up 6% as compared to 2005
  • Signed contracts were $4.46 billion down 38% as compared to 2005
Forth Quarter Results

  • Net income was $173.8 million down 43.9% as compared to Q4 2005.
  • $68.7 million in after tax land write-downs up 97.9% as compared to Q4 2005
  • EPS declined 42% as compared to Q4 2005
  • Total revenues were $1.81 billion down 10% as compared to Q4 2005
  • End backlog was $4.49 billion down 25% as compared to Q4 2005
  • Signed contracts were $706 million down 56% as compared to Q4 2005
2007 Projections

  • $4.34 - $5.10 billion in total revenues for 2007 (a decline of 29% - 17%)
  • Net income between $260 mil - $340 mil (a decline of 62% - 50.5%)

Monday, December 04, 2006

Unstable Stabilization

Today, the National Association of Realtors released its October “Pending Home Sales” report which showed that nationally, pending home sales had declined -1.7% as compared to September and dropped 13.2% as compared to October 2005.

The National Association of Realtors developed the “Pending Home Sales” index as a leading indicator based on a random sampling of roughly 20% of the month’s transactions for exiting home sales and indexed to the average level of contract activity set during 2001.

In typical fashion, David Lereah, Chief Economist of the National Association of Realtors attempted to spin the data to a more positive outlook while presenting yet another version of the now fatigued “market is stabilizing” analysis.

“It’s important to focus on where the housing market is now – it appears to be stabilizing, and comparisons with an unsustainable boom mask the fact that home sales remain historically high – they’ll stay that way through 2007,”

As usual, looking more closely at the results one might draw a less optimistic conclusion:

  • Nationally the index was down 13.2% as compared to October 2005

  • The Northeast region was down 13.5% as compared to October 2005.

  • Additionally, October marks the fifth consecutive month that this region has registered activity BELOW the average activity recorded in 2001, the first year Pending Home Sales were tracked.

  • The West region was down 17.4% as compared to October 2005.

  • The Midwest region was down 15.4% as compared to October 2005.

  • Additionally, October marks the fourth consecutive month that this region has registered activity BELOW the average activity recorded in 2001, the first year Pending Home Sales were tracked.

  • The South region was down 9.4% as compared to October 2005.
So it appears that, year-over-year, contract activity is dropping rather sharply with the All regions now showing significant declines.


Saturday, December 02, 2006

Constructing Capitulation: November 2006

November seems to have brought back a smidgen of reality to real estate Bulls, having spent four magnificent weeks in October basking in the glow of Greenspan only to find that another month of truly heinous housing numbers were just around the corner.

Nevertheless, home building stocks began to present the initial stages of a rally after gaining votes of confidence from a round of analyst upgrades as well as the Bill and Melinda Gate Foundation.

Having only just entered the initial stages of this historic housing decline, it will certainly be interesting to see how investors function as accelerating weakness takes a further toll on the home builders.

November gave us the following:

  • NAR's Pending Home Sales report showed increasing declines to existing home sales both nationally and regionally, but most notably in the Northeast and Midwest regions where home sale activity has registered below 2001 levels for several months running.
  • A New Construction report showing housing starts plummeting to a six year low while regionally, housing permits showed some truly astronomical declines.
  • NAR's third quarter wrap-up showing that now 39 states are experiencing home sale declines with many of the formally hot areas showing high double-digit drop-offs.
  • The White House significantly downgrading its expectations for GDP for the remainder of 2006, 2007 and beyond.
  • An Existing Home Sales report showing the greatest single monthly drop to national median home price on record as well as a host of significant sales declines.
  • A Revision to Q3 GDP showing further declines in “Residential Investment” shaving a whopping 1.16% from GDP.
  • A New Home Sales report showing a host of truly astounding sales declines with the regional leader, the Northeast, presenting a 52.6% drop-off.
Now, December is opening with another, significant indicator that the housing decline is having a wider impact on the overall economy with the latest release of the Commerce Departments “Construction Spending” report.

The October report presented significant downward revisions to the August and September “residential construction” values resulting in an even more dramatic fall-off over the last 11 months.

Key Report Details:

  • The seasonally adjusted annul rate of private residential construction spending has now dropped 10.29% from the peak set back in December of 2005.
  • Overall private residential construction spending dropped 9.4% as compared to October 2005.
  • Single Family residential construction spending dropped 17.2% as compared to October 2005.
  • The latest 9.4% year-over-year decline is the LARGEST percentage drop in 12 years and the greatest drop to date for this year and for this cycle.


November clearly struck a dissonant chord to Octobers, maestro lead upbeat “worst is behind us” tune, now it will be interesting to see if December brings some sharp refocused expectations for the American Consumer and possibly even some reflection on housing related negative wealth effect should this holiday season be slow.

Friday, December 01, 2006

Turning The Titanic

Like a colossal ocean liner executing a slow but concerted about face, the country’s housing market is in the midst of a striking transition.

After years of outstanding growth to home prices, the first three quarters of 2006 have brought certain evidence that price appreciation in most of the country is decelerating and in some areas even going negative.

Yesterday, the Office of Federal Housing Enterprise Oversight (OFHEO) released its third quarter report on national home prices showing the pronounced slowdown through its long running home price index series.

“Our newest data confirm last quarter’s data that the housing market is in a decidedly different stage,” said OFHEO Director James B. Lockhart. “With U.S. house prices growing less than one percent during the third quarter, it provides more evidence that the long forecasted national deceleration in house prices is occurring. Given the five-year appreciation prior to this quarter of 56.8 percent, the slowdown is not unexpected. There are still some areas where appreciation rates remain very high but now they are the exception rather than the norm,” Lockhart said.

To better help visualize the OFHEO home price index, I have implemented a tool that allows you to dynamically view and mix any of the 442 different statistical regions that are reported on.

Click HERE to use the tool which is also found in the upper right list of “Cool Tools”.

Below is a chart generated by the tool that displays the US states that are actually experiencing price declines (click for larger version).


Thursday, November 30, 2006

Boston Globe Befuddled!

In yet another example of the traditional media showing itself to be completely incapable of providing an truthful, accurate and unbiased account of current events, Kimberly Blanton, a staff “residential real estate” reporter revealed an interesting peek into the sorry workings of the Boston Globe.

Wednesday morning, the Boston Globe published an article entitled “End of housing decline near?” with the summary line “Drops in price and sales moderate, hinting market may be starting to stabilize” within which Kimberly quotes a host of real estate insiders who, in typical fashion, portray the current housing decline in Massachusetts as showing signs of stabilization.

Later in the day, Boston.com hosted an “online real estate chat” where Kimberly fielded questions about the state of the housing market and reflected on her article.

I posed to her this single question:

SoldAtTheTop: “Given that (1) Inflation adjusted median single family home price has been below 2004 median price since April and that August and Sept actually sent prices below the median set in 2003. (2) October has shown the lowest volume of sales any October since 1994. (3) Massachusetts is now poised for the greatest yearly sales drop of single family homes in at least the 17 years that sales have been charted. How are you able to responsibly report that there are "signs of market stabilization"?”

To that she answered:

Kimberly_Blanton: “That's a great question. Frankly, an editor threw that in & I'm not sure why. It's too early to say for sure what will happen. We can only look at the numbers and see which direction they're going. As I quoted Sue Hawkes saying - and she's accurate - the sales declines and price declines were smaller. That doesn't mean we're out of the woods and there could be more trouble ahead. However, the economy is good. Thanks for your input.”

..."Frankly, an editor threw that in & I’m not sure why?!?!?!?"

What has happened to the traditional media?

A reporter pens an article that, as its premise, suggests that recent housing data might be showing signs of “market stabilization” and the reporter not only doesn’t agree with the premise, she doesn’t even KNOW WHY the point was being made!

Not to mention, this is not some rinky-dink local paper, it’s the Boston Globe!.. supposedly one of the nations premier news organizations.

Hopefully all who read this post will stop for a moment to reflect on the fact that although traditional news sources hold a degree of credibility granted by their history and longevity as news organizations, that doesn’t guarantee that their product is of high quality.

To the contrary, it seems now more than ever that the conflict between advertising-business interests and reporting what’s in the best interest of readers has rendered the traditional media all but hollow of any legitimate content.

The Blogesphere and other forms of “new media” aren’t perfect but I would suspect you would be hard pressed to find a committed blogger that, when questioned, wouldn’t know why they published a particular post or put forward a particular position.

Finally, Ill leave you with a final thought.

The National Association of Realtors has single handedly crafted some of the most popular and widely held mythical notions concerning the housing market and residential real estate but I bet if you asked around, it would be virtually impossible to find anyone who absorbed any of these ideas directly from a NAR press release.

No. It has been the traditional media that has perpetuated these half truths disseminating them to the masses, without even a hint of skeptical insight or analytical wisdom.

Could “Real Estate Section” advertising revenues be so important that national newspapers become effectively popularized mouthpieces for an industry that has shown itself on countless occasions to function entirely out of its inherent self interest?

Here’s a link to the entire transcript of the “online chat” with Boston Globe reporter Kimberly Blanton.

Wednesday, November 29, 2006

New Home Sales Collapse!

Today, the U.S. Census Department released its monthly “New Residential Home Sales” report for October displaying, yet again, the dramatic and unprecedented extent to which home construction is collapsing.

Generally reported as showing prices increasing and sales declining, today’s report could not have done more to shatter the false notions of “the worst being behind us” or housing “market stabilization” as spun previously by Greenspan and Lereah.

The report does, in fact, show an increase to both median and average price for a new home but as we all are well aware, the significant incentives that home builders have been offering are NOT reflected in this report so the price movement is a bit of a “red herring”.

The current edition of the New Home Sales report looked completely abysmal.

Among other things, the report showed high double digit declines to homes sales at the national level and in every region.

Look at the following summary of today’s report:

National

  • The median price for a new home was up 1.8% as compared to October 2005.
  • New home sales were down 25.4% as compared to October 2005.
  • The inventory of new homes for sale increased 13.9% as compared to October 2005.
  • The number of months’ supply of the new homes has increased 55.6% as compared to October 2005.
Regional

  • In the Northeast, new home sales were down 52.6% as compared to October 2005.
  • In the West, new home sales were down 36.5% as compared to October 2005.
  • In the South, new home sales were down 15.4% as compared to October 2005.
  • In the Midwest, new home sales were down 26.5% as compared to October 2005.

GDP In The Balance

Although today’s upward revision to GDP will likely fuel a round of exuberant trading on Wall Street as Bulls attempt to shrug off any pessimism about a slowing economy, a closer look at the Q3 GDP preliminary report shows that “Residential Investment” actually worsened since the advance GDP report published in October.

Third quarter “Residential Investment”, that is, investments in residential housing, declined by the upwardly revised 18% depressing real GDP by 1.16%.

A key “take away” from this report is that the decline to residential housing is persistent.

Many suggested that the second installment of Q3 GDP would revise down the decline to residential investment first presented in October thus lessening its effects on real GDP.

This should present even more evidence that the housing bust is having significant and sustained impact on the economy and will surely continue to depress GDP as the situation worsens.

Also, it’s important to note that investment in “Non-Residential Structures”, that is, commercial real estate, was revised up to show an increase of 16.7% which essentially offset the dramatic decline to residential housing.

It will be interesting to see if commercial real estate can continue this offsetting of the declines in residential real estate or whether the trend is short lived.


Copyright © 2006

PaperMoney Blog - www.paperdinero.com
All Rights Reserved
Disclaimer

Tuesday, November 28, 2006

Pinocchio-Economics

The Massachusetts Association of Realtors (MAR) coverage of this historic housing decline is starting to become truly revolting.

At least the National Association of Realtors (NAR) can hide behind nationalized numbers while attempting to spin a feeble “market stabilization” picture.

MAR’s effort to twist some of the country’s worst regional housing numbers into a positive light will hopefully disclose their self serving interests and further discredit an institution that has long since lost touch with reality.

Here are some truly baseless quotes from MAR President David Wluka published in Tuesday's home sales press release:

“It appears as though the market correction may be about over,” said Wluka going on to suggest that “Prices have stabilized in the single-family market and probably aren’t far from bottom for condos. For any one who has been attempting to time the market, this wouldn’t be a bad time to jump in before mortgage rates start inching up or supply levels begin to drop.”

Unfortunately for Wluka though, the downturn is NOT stabilizing and In fact, this October showed the lowest volume of single family homes sold for any October since 1994.

To put things in a little better perspective, 1994 squarely predates the current housing bubble that really started inflating in 1997. So, if home sale volume is starting to retrace to pre-bubble levels, it’s difficult to understand how an honest assessment could yield “market stabilization”.

As with last month, its important to note that the impact of the housing slowdown has been so significant that Massachusetts is now poised for the greatest yearly sales drop of single family homes in at least the 17 years that sales have been charted.

Today’s 16.52% sales drop brings the current year’s total of single family home sales to only 35,293, well below the 41,672 total for the first 10 months 2005.

Review the following chart:


As you can see, Massachusetts is headed for roughly 41,743 total single family home sales for 2006 and that’s with a fairly optimistic projection of only a 10% sales decline for the months of November and December.

The following chart demonstrates what this drop off would look like in the context of single family home sales since 1990. Click on it for a larger, more readable version.


As in months past, be on the lookout for the inflation adjusted charts produced by BostonBubble.com for an even more accurate "real" view of the current market trend.

Key Statistics for October 2006

  • Single Family Sales down 16.52% as compared to October 2005
  • Single Family Median Price down 2.0% as compared to October 2005
  • Condo Sales down 17.6% as compared to October 2005
  • Condo Median Price down 3.7% as compared to October 2005
  • Inventory of single family homes have risen for 20 consecutive months and now stands at 40,254 units listed on the market through MLS. This represents 12.4 months of supply.
  • Single Family average “Days on Market” stands at 126 days in October as compared to 113 days for October 2005
  • Condo average “Days on Market” stands at 143 days in October as compared to 99 days for October 2005

Key Facts

  • September marks the Seventh (MAR), (Tenth per The Warren Group) consecutive month of declining sales.
  • Boston leads the nation in price reductions with 46.4% of homes listed on the MLS having been reduced.

Briskly Eroding Home Prices Yield Market Stabilization?

Today, the National Association of Realtors released its monthly “Existing Home Sales” report for October along with some interesting analysis which again attempts to paint a picture of market stabilization.

As David Lereah puts it:

“The present level of home sales demonstrates some confidence in the market, but sales are lower than sustainable due to psychological factors,”

Additionally, NAR President Pat Vredevoogd Combs added:

“With the exception of parts of the West, sellers are cutting their price enough to encourage sales,” said Combs. “It’s an especially good market for sellers in areas with rising jobs and a growing population where prices remain moderate – those are the areas now with the strongest price growth.”

In reality though, October not only marked the seventh straight month of sales declines but also the greatest drop to median home prices on record EASILY BEATING THE PRIOR RECORD SET LAST MONTH.

Furthermore, October seemed to mark a turning point for median prices. Having taken a back seat to the whopping declines in sales seen in months past, median price declines are now escalating, showing the true ramifications of the prolonged fall off in home sales.

Additionally, this month virtually EVERY price and sales indicator was DOWN (with the exception of condos in the Midwest region) and EVERY inventory and supply indicator was UP, presenting more indisputable evidence that the housing market is declining dramatically and thoroughly across every region of the US.

There should be little doubt now that the housing market is experiencing a significant correction even when looking at a national scope.

The following shows the data form all the NAR reports released today consolidated into one view:

National Statistics (Year-Over-Year as compared to October 2005)

  • Median price of all existing homes declined by 3.5%
  • Median price of existing single family homes declined by 3.4%
  • Median price of existing condos declined by 5.3%
  • Sales of all existing homes (single family, condo, etc.) dropped 11.5%
  • Sales of existing single family homes dropped 11.0%
  • Sales of existing condos dropped 14.5%
  • Inventory for all existing homes increased 34.4% to 3,854,000
  • Inventory for single family homes increased 32.7% to 3,290,000
  • Inventory for condos increased 45.4% to 564,000
  • The number of months supply for all existing homes increased by 51.0% to 7.4 months.
  • The number of months supply for all existing single family homes increased by 50.0% to 7.2 months.
  • The number of months supply for all existing condos increased by a whopping 68.5% to 9.1 months.
Regional Statistics (Year-Over-Year as compared to October 2005)

Northeast

  • Median price of all existing homes declined by 5.2%
  • Median price of single family homes declined by 5.2%
  • Median price of condos declined by 4.0%
  • Sales of existing single family homes dropped 7.5%
  • Sales of existing condos dropped 16.4%

West

  • Median price of all existing homes declined by 0.6%
  • Median price of single family homes declined by 0.1%
  • Median price of condos declined by 12.2%
  • Sales of existing single family homes dropped 18.8%
  • Sales of existing condos dropped 15.8%

South

  • Median price of all existing homes declined by 7.0%
  • Median price of single family homes declined by 6.7%
  • Median price of condos declined by 12.1%
  • Sales of existing single family homes dropped 7.6%
  • Sales of existing condos dropped 19.8%
Midwest

  • Median price of all existing homes declined by 1.2%
  • Median price of single family homes declined by 2.2%
  • Median price of condos increased by 3.8%
  • Sales of existing single family homes dropped 10.7%
  • Sales of existing condos dropped 3.0%


Saturday, November 25, 2006

Hurry! Hurry! Step Right Up Folks!

Not to be left out of the fun had in attempting to persuade unsuspecting buyers to enter the collapsing housing market, the National Association of Home Builders (NAHB) has seen fit to present a similar, albeit far smaller, web campaign entitled "It's A Great Time To Buy".

As with the National Association of Realtors recent "Buy Now" campaign, the NAHB literature is filled with a myriad of half truths and scare tactics.

The following is a list of questions and answers published on the campaign page:

Q: AS A FIRST-TIME BUYER, SHOULD I WAIT UNTIL PRICES GO LOWER TO BUY A HOME?

A: No.

If you continue to wait, you may never be able to afford to get into the housing market. Even as home prices are currently moderating – or even falling in some areas – rents continue to climb. The best way to build household wealth is to own a home. Once you become a home owner, you are able to take advantage of the generous tax deductions that homeownership offers, and you begin to build equity in your property. As your property builds in equity, you can use those gains to sell your starter home and afford to move into a bigger house.

Q: IF I WAIT TO BUY A HOME, WON'T PRICES GO DOWN EVEN LOWER?

A: Timing the market isn't a great idea.

All the market fundamentals show that now is a good time to buy – prices are down, interest rates are affordable, there are lots of homes to choose from and you can bargain with sellers.

If you try to wait and time the market until it hits rock bottom, you are likely to lose out. Just as no one can accurately predict the peaks and valleys of the stock market (name one person who sold their tech portfolio in April of 2000), the same holds true for housing. If you sit on the fence and wait for the absolute best deal, you could end up literally waiting for years. And most likely, your guess on market timing would be wrong. But if you choose to buy now, you will not only be in the driver’s seat during the buying process, you will also reap the gains of price appreciation once you become a home owner. Remember, those who purchased homes in the early 1990s during the last big economic and housing downturn came out as big winners.

Q: ISN'T IT BETTER TO "PLAY IT SAFE" AND KEEP RENTING UNTIL THINGS ARE MORE CERTAIN?

A: No.

The best way to “play it safe” is to actually buy a home. And here’s why. Studies show that owning a home is the best way to build household wealth. The sooner a person owns a home, the faster they begin to build up equity and wealth. When you buy a home, you are also purchasing price stability, knowing that you will pay the same monthly payment for the life of your 30-year mortgage.

Now consider the current rental market. During the past few years, many rental units have been converted to condos. As a result, there are fewer apartment rentals on the market. While home prices have been moderating, rents have been going up. Each year, your rent can easily go up a minimum of 5 percent to 10 percent. Where is the economic security in knowing that it is possible your rent could surge 30 percent in three years? You don’t receive any tax benefits from paying rent, nor do you accumulate any price appreciation, as you would if you owned a home of your own.

All of the economic fundamentals show that this is a good time to buy a home and that there is upward pressure on rental apartments. The real risk isn’t in buying a home, it’s continuing to rent.

Q: SHOULD I INVEST MY MONEY IN THE STOCK MARKET, OR USE IT TO BUY A HOME?

A: Buy a home.

Thanks to the concept of “leveraging,” purchasing a home is by far the best long-term investment. Leveraging means putting down a small amount of money to earn a big return.

For example, say you use that $10,000 to purchase a $150,000 home, and the house appreciates five percent during the first year. That means after one year, the house would be worth $157,500 – a gain of $7,500. Your annual return on your $10,000 investment would be a whopping 75 percent.

By contrast, putting the same $10,000 in the stock market and posting a similar 5 percent gain would only net a $500 return on investment.

And as a home owner, your savings continue to grow in two ways. Every year, a greater portion of your monthly mortgage payment goes to the principal, reducing the overall loan amount. Second, your home appreciates over time, making it one of the very best financial investments. Not only is homeownership a stepping stone to a future of financial security, it also helps to build neighborhoods and strengthen communities. It is truly the cornerstone of the American way of life, and the fulfillment of the American dream.

Thursday, November 23, 2006

Food For Thought

It's been a common practice in recent years for some in the real estate industry to attempt to calm any fears of an impending housing collapse by reciting some variation of the following theme:

“The housing market is not like the stock market... homes are not as liquid as stocks... Homes aren't traded like stocks.... A stock can drop in value to zero where a home has real measurable value...”

While these assertions are all essentially true, they tend to rely heavily on an overly simplistic view of the dynamics of the housing market and thus only portray part of the picture.

First, is it accurate to suggest that there is inherently a greater degree of price stability in the housing market versus the stock market?

For sanity's sake, Lets simply establish that housing prices can truly drop and in fact, fairly significantly even by standards commonly used by stock investors.

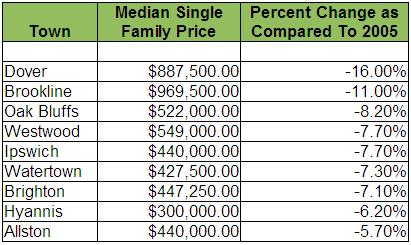
The following is a list of just some of the more notable price corrections occurring right now in greater Massachusetts and the Boston metro area:


As you can see, two towns listed are already technically in “correction” as defined by having shown at least a 10% price decline while the others will likely follow.

So, although there was never a “Black Monday” style crash in which prices plummeted on a single day, home prices still declined considerably in the first nine months of 2006, a relatively short period of time given the type of asset.

Remember, home prices were still “rocketing” up the slope from 2004 to 2005 so the transition into such deep negative territory so soon in 2006 represents some fairly significant price movement.

To put this price movement in better perspective, think of how you would regard an individual stock or stock fund that you took a significant position in on January 1st only to find that by September 1st had lost 16% of it's value.

Now lets consider stocks vs. housing in terms of liquidity.

It's certainly true that stocks are more liquid than houses and thus can be traded substantially easier but does a low volume of assets being traded over a long period of time actually help to ensure price stability?

In the stock market, buyers and sellers can trade stocks at a frenetic pace. In most cases, each independent buyer and seller is acting in an almost anonymous fashion so the impact of any one trade on the psychology of all other individual traders is generally minimal.

Of course, there are exceptions such as big institutional traders taking up or selling big positions, but in general, retail stock traders are focused on the overall stock price not the price paid for the last 1 or even 100 shares.

In the housing market, as any seller in the above cited towns can attest, each individual sale price effects the price of all other homes since buyers and, in general, the whole real estate industry relies heavily on the “comp” method of valuing a home.

Using the “comparable” approach to home valuation results in a direct correlation of the perceived value, or loss in value from one home to the next and especially for homes in a close proximity.

So, although homes trade in low volumes, each home sale directly effects each other creating self reinforcing price movement that may appear dramatic both on the way up and the way down.

Additionally, it’s important to remember that prices are set by the participants that ARE actually buying and selling not by the ones sitting on the sidelines which brings up another interesting point.

In the housing market, many sellers must sell for reasons that are not strictly financial such as job change, divorce, and retirement. This effects the market in that participants are motivated to sell for different reasons and in some cases this motivation can lead to price cutting that might be perceived as irrational as individual sellers make choices that suit their own lives.

Sure, in the stock market there are certainly going to be trades that happen as a result of a couple splitting up and liquidating their assets in order to go their separate ways but as you can imagine, the effect of that individual sale would most likely be minimal to the overall stock price.

Lastly, lets consider the effect of loss in value of a home.

Its important to remember that even though a home has intrinsic value, the so called “replacement” value of the house and the inherent value of having exclusive rights to the property, loss of value is loss of value.

Many wrongly think that a home hasn't lost value if it has experienced declines that are less than recent increases to it's appreciation. But the fact is, any loss is a real loss in value. Sure, the house may still have equity but if it has dropped in value you have less.

Housing wealth loss and it's effect on consumption has been the subject of study on several occasions in recent years most notably by Karl Case, John Quigley, and Robert Shiller in their widely read paper “Comparing Wealth Effects: The Stock Market Versus The Housing Market”.

Their findings concluded that “...changes in housing prices should be considered to have a larger and more important impact than changes in stock market prices in influencing household consumption in the U.S. and in other developed countries.”

Tuesday, November 21, 2006

Whit House: “Housing Hit Harder Than Expected”

Today, the White House downgraded it's economic outlook for 2006 and 2007 as a result of the unforeseen severity of the nations housing bust.

"The housing market ... it has been hit, I think, harder than most of us had expected. Most forecasters were expecting a slower decline," Edward Lazear, chairman of the White House's Council of Economic Advisers, told reporters going on to state "Whether it's bottomed out now is still up for grabs,"

Under the administrations new forecast, GDP will grow by 3.1% for 2006, a downward revision of .5% while the GDP outlook for 2007 was lowered to 2.9% from the previous forecast of 3.3% made in June.

Watch CNBC's coverage of the downgrade on BNN now!!.

New President, Same Program

The time has now come for the regular “changing of the guards” over at the National Association of Realtors (NAR) and yesterday's press release entitled “Third-Quarter Metro Home Prices & State Sales Confirm Market Transition” makes the new leadership official.

Within the release, Pat Vredevoogd Combs, the new NAR President who replaces the outgoing Thomas M. Stevens, states:

“With the supply of homes at the highest level in over a decade and historically low mortgage interest rates, it’s become a great time to buy a home,... This window of opportunity will continue into the new year, but inventories are starting to decline and sellers will be less willing to negotiate when conditions begin to balance in most areas around early spring.”

The release went on to show that, as of the third quarter of 2006, 39 states are showing year over year declines in sales with 20 states showing over 10% declines and 9 states showing over 20% declines.

Additionally, every major region in the United States is now showing a decline to the median price for an existing single family home with some metro regions already registering a 5-10% price drop and a record 45 metro regions overall going negative.

So as it seems, not a beat was be missed during the transition between administrations and President Pat Combs appears very well suited to continue NAR's campaign.

At least outgoing President Thomas Stevens will now have all the spare time he needs to devote to the business of selling his Great Falls, Virginia home which today welcomes it's 417th day on the market STILL without a single price reduction.

So lets take this moment to remember and bid former President Stevens a fond farewell and welcome the new President Pat Vredevoogd Combs.

She will surely face an interesting an exciting year ahead.


Monday, November 20, 2006

Realtors at The Crossroads

This must be a particularly confusing and distressing time to be a Realtor, especially for some of the newer association members.

On one hand, you have your own experience of witnessing the stark almost knee-jerk turnaround to the nations housing market showing sales of new and existing homes dropping like a rock while inventory and months supply climb to all time highs.

On the other hand though, there is your associations trusted Chief Economist who, although sounding convincing, has just spent the better part of a year slowly massaging his outlook from “the sky's the limit” to “we've hit the bottom”.

What is a Realtor to do?

Well, theres certainly no point in getting all depressed. Besides, that mood is not very conducive to sales.

Instead, why not attend the National Association of Realtors annual Conference and Expo, be wooed by two former presidents and after knocking back one too many gin fizzes, slide into a nice soothing presentation of classic Lerenomics.

That should completely cleanse you mind of any of those distracting little negative numbers...

And so went the show down at NARdi Gras 2006 and with it, David Lereah's latest, and possibly most creative attempt at crafting a better reality.

It seems that Lereah is not merely capable of spinning the boom but also shows a great proficiency at narrating the bust.

Just peruse the 70+ slides of his latest presentation entitled “The Road to Recovery” to discover just how Lereah plans to sell the concept of market stabilization to both his fellow Reators as well as consumers at large.

Some key slides include titles such as:

  • Stabilizing Pending Home Sales
  • New Home Sales Bottomed
  • Existing Housing Inventory Beginning to Fall
  • New Home Inventory also Falling
  • Months Supply Inventory Past Peak
  • Stabilizing Mortgage Purchase Applications
  • Upturn in Housing Affordability
  • Fundamentals are Improving
  • Unemployment At or Below Natural Rate
  • Record Dow Jones Industrial Average
  • Record Household Wealth
  • Buyers on the Sidelines (need to understand the buyers market will soon end)
  • Negative Media
  • Renters Beginning to Get Squeezed
  • Wake Up and Smell the Equity!
  • Corporate Profits are Strong
  • Buyers are Missing Opportunities if They Postpone


Friday, November 17, 2006

Today’s New Construction Report

Continuing the consistent and ever worsening deterioration of the US housing market, today’s “New Residential Construction Report” provides significant evidence that residential real estate is experiencing a protracted and widespread decline.

As MarketWatch has previously reported, today’s release, showing housing starts plunging to a six year low, should dash any an all hopes that a bottom has been found in the housing market.

Particularly interesting is that this months report show that virtually every indicator is now recording high double digit year over year declines, with the West region again breaking over 40% in declines to housing permits.

Additionally, both permits and starts are now down over 30% nationally with permitting being particularly important as it is a leading indicator of future housing starts.

Here are the statistics outlined in today’s report:

Housing Permits

Nationally

  • Single family housing permits down 3.8% from September, down 31.7% as compared to October 2005
Regionally

  • For the Northeast, single family housing permits up 2.1% from September, down 23.3% as compared to October 2005.
  • For the West, single family housing permits down 9.7% from September, down 41.8% as compared to October 2005.
  • For the Midwest, single family housing permits down 3.0% from September, down 33.9% as compared to October 2005.
  • For the South, single family housing permits down 2.2% from September, down 26.9% compared to October 2005.
Housing Starts

Nationally

  • Single family housing starts down 15.9% from September, down 31.8% as compared to October 2005.
Regionally

  • For the Northeast, single family housing starts up 10.9% from September, down 22.2% as compared to October 2005.
  • For the West, single family housing starts down 9.1% from September, down 32.9% as compared to October 2005.
  • For the Midwest, single family housing starts down 7.3% from September, down 33.1% as compared to October 2005.
  • For the South, single family housing starts down 24.8% from September, down 32.4% as compared to October 2005.
Keep in mind that this particular report does NOT factor in the cancellations that have been widely reported to be occurring in new construction.

As further reports are released, cancellations should show an even greater effect on permitting, starts and completions.