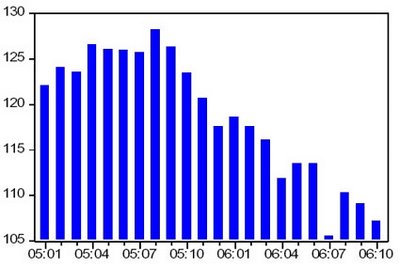
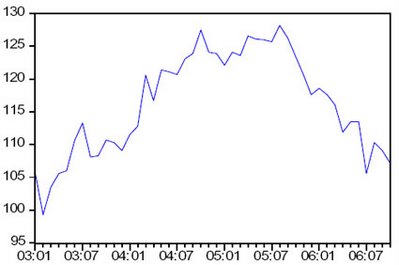
 Today, the National Association of Realtors (NAR) released its November “Pending Home Sales” report which showed that nationally, pending home sales had declined 0.5% as compared to October and dropped 11.4% as compared to November 2005.
The National Association of Realtors developed the “Pending Home Sales” index (PHI) as a leading indicator based on a random sampling of roughly 20% of the month’s transactions for exiting home sales and indexed to the average level of contract activity set during 2001.
In typical fashion, David Lereah, Chief Economist of the National Association of Realtors attempted to spin the data to a more positive outlook while presenting yet another version of his fatigued Pinocchio-economic “market has bottomed” analysis.
“Because there is a stronger parallel between changes in the index from a year ago and the actual pace of home sales in coming months, the index is pointing toward fairly stable home sales in the near future, … That is another indicator that home sales likely bottomed-out in September.”
As usual, looking more closely at the results one might draw a less optimistic conclusion:
- Nationally the index was down 11.4% as compared to November 2005
- The Northeast region was down 9.6% as compared to November 2005.
Additionally, November marks the sixth consecutive month that this region has registered activity BELOW the average activity recorded in 2001, the first year Pending Home Sales were tracked. - The West region was down 15.9% as compared to November 2005.
- The Midwest region was down 11.9% as compared to November 2005.
- The South region was down 8.9% as compared to November 2005.
The top chart shows the progress of the national PHI since January of 2005 while the lower chart shows the progress of national PHI since January 2003. The left side of both charts is the PHI value, the bottom is the date.


So it appears that, year-over-year, contract activity is dropping rather sharply with ALL regions now showing significant declines.
housing+bubble housing bubble realtor NAR national+association+of+realtors David+Lereah pending pending+home+sales home+sales decline economy real+estate Greenspan Bernanke home+builders interest+rates mortgage ARM+loan
Copyright © 2007
PaperMoney Blog - www.paperdinero.com
All Rights Reserved
Disclaimer
Copyright © 2007
PaperMoney Blog - www.paperdinero.com
All Rights Reserved
Disclaimer