
Today, like 2007, the economic zeitgeist is marked by a palpable sense of significant headwinds and the uneasy feeling of oncoming disaster.
True, the uncertainty and potential risks driving this sense of doom now are very different from the circumstances that existed then, but every cycle always brings a unique set of challenges and a distinctive narrative as to why markets overshot and why they are bound to revert to the mean.
This is simply how history rhymes… the precise circumstances don’t just play out over again but instead, provide a rough guide that an astute observer can leverage to navigate the ever evolving market conditions.
With that said though, there are some repeated dynamics that effect every cycle that play out like basic truisms coming as a result of the fundamental foibles of human behavior as expressed collectively by the market.
For example, the “boom-bust” cycle itself appears to be a “two steps forward and one step back” natural growth scheme whereby, collectively, market participants seemingly are always willing to take the optimism of the growth phase of expansionary market environment a few steps too far and ultimately have to suffer a major set-back when the system rebalances.
Further, at the height of every the “boom phase”, there are always some activities that, in retrospect, were obviously completely frivolous speculation fueled by the blinding fever dream of fast and easy riches.
Finally, the average speculator and other naïve participants always seems to struggle to recognize when the boom is over leading them to inaction, until they are faced with incontrovertible evidence of the emerging “bust phase” after which, they race for the exists like so many scalded monkeys.
By 2007, the “Housing Bubble” had reached a level that was so clearly an overshoot, that any sensible observer with just basic “rule of thumb” analysis could forecast that trouble wasn’t far off.
Today, we have an “Everything Bubble” marred with numerous frivolous speculations together with a Fed finally willing to stimulate a “prick” providing the risk of a major reversion.
Given all the obvious headwinds, one has to wonder at what point will come the “Minsky Moment”, namely the sudden collapse of asset values as market participants finally reach a collective panic in the face of the mounting evidence that a major downturn is inevitable.
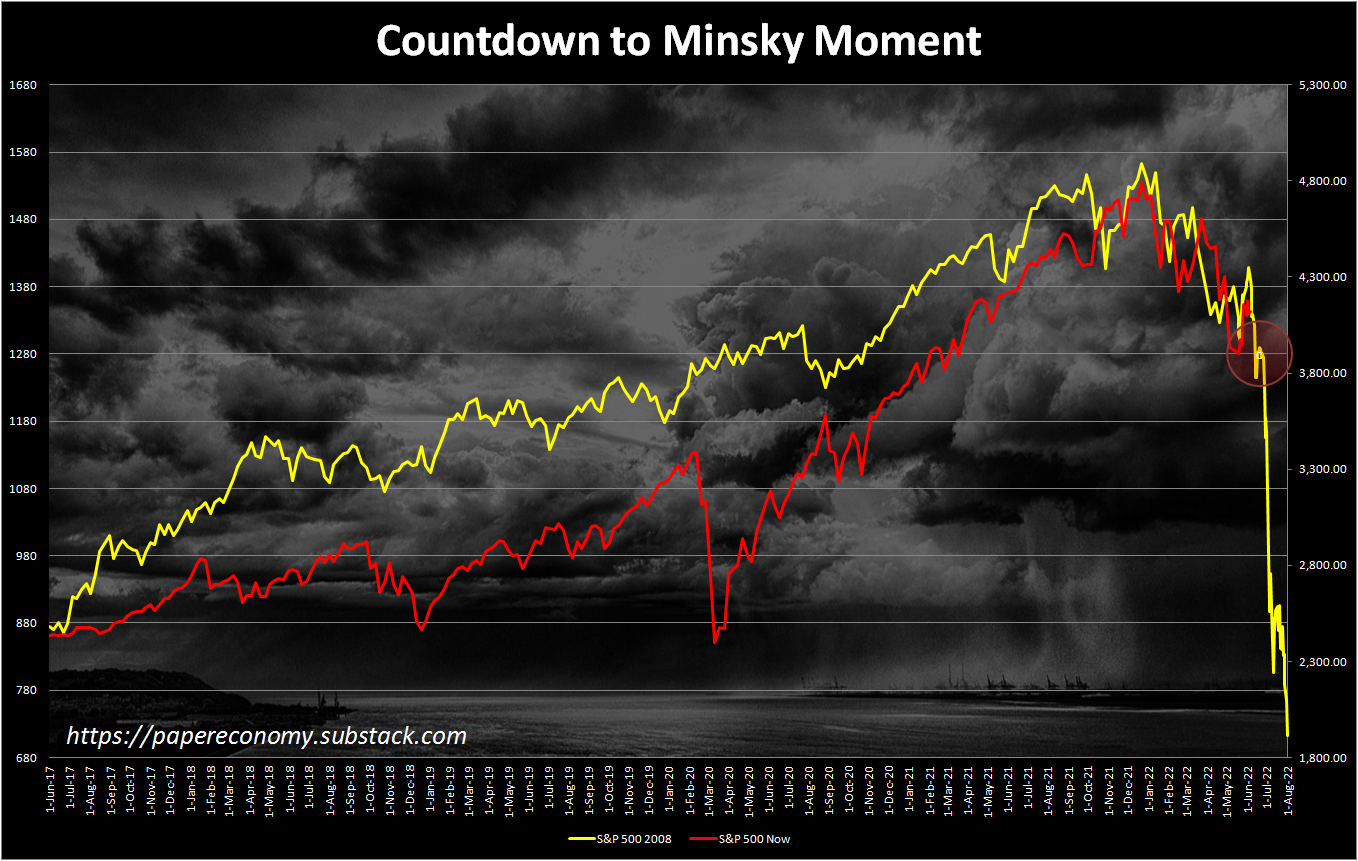
While there is no way to truly know, let’s see if we can gain any insight in tracking today’s evolution of panic by comparing the current trends in the S&P 500 against the course taken in 2007.
The following data visualization (click for larger view) shows the S&P 500 from the buildup and peak of 2007 bubble overlaid and aligned with the peak of this cycle providing a simple comparison of how a panic can evolve. Again, history never repeats exactly but this visualization can provide a rough point of comparison and some valuable overall perspective.
Like the above post? Consider subscribing to my Substack for additional insights and content today!