Showing posts with label Federal Reserve. Show all posts

Thursday, January 07, 2016

The Fed's Unraveling: Fisher's Reverse Wimpy Factor

While it should come as no surprise that former Federal Reserve Bank President (and former voting member of the FOMC) Richard Fisher speaks directly about Fed activities and his dissent of the committee's support of QE3, the level of candor of yesterday's CNBC interview appears pretty shocking.

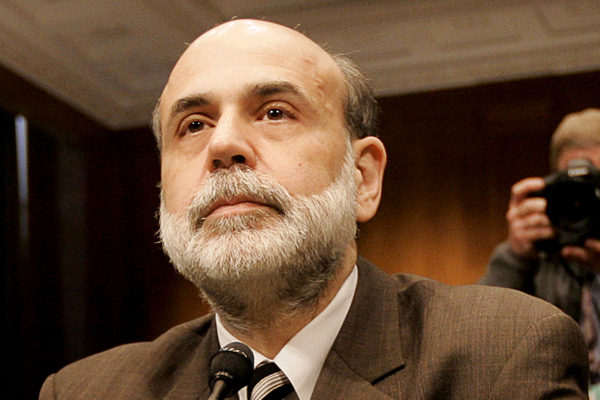
Given that one of the main accomplishments outlined by former Federal Reserve Chair Ben Benrnanke was the creating of a "wealth effect" by working to boost the stock market, Fisher's assertion that market is now due for a correction appears to indicate that he has completely broken ranks and further, is looking to distance himself from the Fed policy decisions made during the Great Recession.

The below video quality is very poor but well worth the watch given that the clip currently posted at CNBC edited out most of the interesting commentary.

Thursday, December 31, 2015

Yellen’s Myth (Part 1)


Notwithstanding Fed Chair Yellen’s certainty about her “myths”, recession indicators are continuing to accumulate as the current U.S. economic expansion continues to clearly trend into its twilight period.

While Yellen is apparently not able to “see anything in the underlying strength of the economy that would lead me to be concerned” about recession, let’s take a look at just a few points of interest that she clearly must have missed.

First, there has been notable protracted weakness in industrial production which is now showing a year-over-year decline of over 1%, a VERY strong indicator of fundamental weakness that is virtually always associated either directly with current or looming recession.


Additionally, both Industrial Production and Capacity Utilization have now show simultaneous notable year-over-year declines, an event that is literally associated with every recession since both data sets have been tracked.


Next, jobless claims appear to have hit the low for this expansion which, as we know from all other past expansions, generally does not stay at this level for very long.

In fact, population adjusted Continued Jobless Claims (continued claims as a percentage of non-institutional population) is at the lowest level since 1969, a strong indicator that insurance claims, and by proxy the general employment situation, has reached its best levels of the expansion.


Thursday, April 18, 2013

The Philly Fed Business Outlook Survey: April 2013

The March release of the Federal Reserve Bank of Philadelphia Business Outlook Survey (BOS) indicated a slight worsening of the regions manufacturing activity with the current activity index falling to a weak expansionary level of 1.3 while assessments the future activity plunged to a level of 19.5.

The following chart shows the current and future activity indexes both with their corresponding 3-month moving averages. The red line marks the threshold between contraction and expansion for these diffusion indexes.

Friday, September 09, 2011

Welcome To the Zero Credibility Bound

Last night’s “job bill” speech was nothing short of a travesty, a decisive and freakish reminder that America has been taken deeply down the worst possible path.

While somewhat surprising, I suppose it just makes sense that both the Federal Reserve and the Federal Government have simultaneously lost all credibility and that both are seemingly exhausted of policy tools.

When the window of reality opened briefly in 2008 with colossal failures and crisis in every direction, many Americans got a brief and uncomfortable sense of what it feels like to be truly concerned about their current wealth and future prosperity… a sharp contrast to the heyday of the housing boom era where levering up on residential real estate was all the rage.

With a host of broken, deteriorating and dysfunctional markets, stocks down over 50%, a few notable public bank runs and several earth shaking “buck breaking” money market events, the Feds panicked and abruptly snapped into a mode of propping and bailing using creative accounting trickery, blanket guarantees and boat loads of massive Keynesian boondoggles.

What we are now seeing, I believe, is the clear recognition that the propping and stimulus action was an unmitigated failure and further that the political process and institutions that brought us these “solutions” are as weak and phony as the “recovery” they attempted to manufacture.

Bernanke’s speech yesterday at the Economic Club of Minneapolis revealed this somewhat in his recounting of events of the past few years and his recognition that the massive housing slump has made all the difference to the severity of the recession and the lackluster “recovery”, a fact that the Federal Reserve appears to have underestimated at every turn.

With a litany of platitudes and talk of the “enduring strength” of the American economy, Bernanke concluded his speech by assuring listeners that the long term prospects of the U.S. economy does not have to be materially affected by the ongoing financial crisis so long as we take the necessary steps to “secure that outcome”.

President Obama did no better last night when he outlined a list of futile fiscal policy gimmicks that could have been borrowed right from the “American Recovery and Reinvestment Act” a 2009 policy action carrying over twice the supposed Keynesian punch that we all know did little to nothing to build a durable long term recovery.

It’s over folks… By hook or crook the Feds did their best to reassemble our Humpty Dumpty economy but it can’t be done… you can’t paper over the serious mistakes made by millions of households or the bad policy created by generations of Washington DC vote peddling hucksters.

Thursday, September 08, 2011

Outstanding Contraction!: Commercial Paper Outstanding August 2011

The Commercial Paper (CP) market is essentially a private debt market used by corporations as a generally cheaper means of funding typical recurring operations than drawing on a line of bank credit.

Commercial paper, as financial instrument, is by no means a recent innovation and, in fact, you can read about how the CP market was affected by the many historic financial shocks experienced by the U.S. (read Panic on Wall Street: A History of America’s Financial Disasters)

Although the Federal Reserve was able to artificially bring CP rates down significantly since the shocking 615 basis point spread blowout (A2/P2 spread) of late 2008, they had not been successful in preventing an overall contraction in the CP market.

The Federal Reserve calculates and published the total amount of CP outstanding every week and for August commercial paper outstanding presented a serious pullback dropping from a recent high set back in July and expanding at a meager rate of 3.16% on a year-over-year basis to $1097.80 billion, a level that is still notably lower than even the worst periods of the last two recessions.

Tuesday, May 17, 2011

QE3, QE4, QE5…

QE3 is in the offing…

Consensus expectations just seems to demand it as a generation of gambling speculators, swindlers, government policy junkies and others with short attention spans and a psychopathic indifference for the soundness of the financial system panic at the least sign of slowdown and line up for another dose of the Feds easy money.

Looking at some of the latest trends, a slowdown of sorts would not be so surprising.

The economy is still being seriously impacted by the evolving housing decline, unemployment remains at 9%, oil prices are near $100 a barrel with gasoline prices reflecting that fact, the Federal Government is toying with the debt ceiling, China is likely overheating as it inches ever closer to parabolic residential real estate prices and likely an ugly crash, other notable leading emerging markets like India and the Russian Federation are continuing to slow, Greece and other European countries are moving closer to debt restructuring… the list of negative externalities runs long yet they all carry the telltale ring of the Great Recession about them.

This is the point at which one, having been schooled by the Fed over many years, must begin to ask the question “What will the Feds response be?”… as if a response by the Federal Reserve is nearly a reflexive action to a consensus expectation of looming slowdown.

The answer to that question should not require such a stretch of imagination… the simple short answer is QE3… no more, no less.

Why would the Fed stop now? Should a slowdown materialize, it will ultimately been seen as an offspring of the Great Recession and treated as such.

Recognize that during last month’s historic Fed press conference, “Helicopter” Bernanke made no quibble of the fact that the Fed will continue the principle reinvestment function that they have been carrying out ever since they acquired such a sizable bounty of mortgage securities, a clear sign that pumping liquidity is not only the response de jure but the de facto response.

Like a pair of dysfunctional sweethearts, the Fed knows no different course of action then easing and the consensus expects it, so easing it will be.

But as we move further and further from the point where the Feds intervention is viewed as “pump priming” and nearer a more accurate perception of it as the “pump”, one has to wonder when consensus will begin to lose faith and worry that this scheme has no merit.

Only then will we ultimately realize the true consequence of the years of Fed actions.

Monday, March 07, 2011

Is the Fed Gearing Up for QE3?

This morning the President of the Federal Reserve Bank of Atlanta, Dennis P. Lockhart, gave a speech titled “Economy Today and Policy Framework for Today and Tomorrow” in which he outlined his views on the state of the economy and the role the Fed has played.

Probably the most interesting segment of this discussion was related to quantitative easing (the process by which the Fed has further eased monetary policy after the traditional Fed funds rate has met the zero bound) and more specifically the potential for QE3.

“With the information I have today, my first inclination is to be very cautious about extending asset purchases after June. Given the emergence of new risks, however, I prefer a posture of flexibility as regards policy options. As we have seen, conditions can change rapidly, so I will continue to evaluate the incoming information as much as possible with fresh eyes as I approach each meeting and each decision.”

This might be one of the first instances of a Fed president insinuating that QE2 might be superseded by a third round of easing (LSAP3… large scale asset purchase 3) should the Fed believe that the risks facing the economy warranted it.

Interestingly, Lockhart suggests that the current $600 billion QE2 program was equivalent to a 75 basis point cut in the federal funds rate which, when put into context with the historical impact of such a large fed funds rate cut, gives you a sense of the risks they measured for a double-dip last year.

It’s important to recount that the Fed is roughly half way through to the $600 billion goal and while many have suggested that, given the strengthening economy, the Fed might end the purchase program early, Lockhart appears to assume that the program will complete and then some.

On the topic of exiting from the current policy, Lockhart rules out the potential to simply allow the securities from QE1 and QE2 to passively unwind through maturity and suggests that the Fed will have to implement an active exit strategy.

Finally, Lockhart believes that economic analysts and forecasters ought to return to paying close attention to the monetary and credit aggregates and money measures for signs of inflation creeping into the economy.

Wednesday, February 17, 2010

Reading Rates: MBA Application Survey – February 17 2010

The Mortgage Bankers Association (MBA) publishes the results of a weekly applications survey that covers roughly 50 percent of all residential mortgage originations and tracks the average interest rate for 30 year and 15 year fixed rate mortgages, 1 year ARMs as well as application volume for both purchase and refinance applications.

The purchase application index has been highlighted as a particularly important data series as it very broadly captures the demand side of residential real estate for both new and existing home purchases.

The latest data is showing that the average rate for a 30 year fixed rate mortgage remained unchanged since the last week at 4.94% while the purchase application volume declined 4.0% and the refinance application volume decreased 1.2% over the same period.

It’s important to recognize that despite the Federal Reserve’s “quantitative easing” measures and record low interest rates, the purchase application volume now sits near the lowest reading since 2000.

The following chart shows how the principle and interest cost and estimated annual income required to cover the PITI (using the 29% “rule of thumb”) on a $400,000 loan has changed since November 2006.

The following chart shows the average interest rate for 30 year and 15 year fixed rate mortgages over the last number of weeks (click for larger version).


The following charts show the Purchase Index, Refinance Index and Market Composite Index since November 2006 (click for larger versions).


Wednesday, February 10, 2010

Reading Rates: MBA Application Survey – February 10 2010

The Mortgage Bankers Association (MBA) publishes the results of a weekly applications survey that covers roughly 50 percent of all residential mortgage originations and tracks the average interest rate for 30 year and 15 year fixed rate mortgages, 1 year ARMs as well as application volume for both purchase and refinance applications.

The purchase application index has been highlighted as a particularly important data series as it very broadly captures the demand side of residential real estate for both new and existing home purchases.

The latest data is showing that the average rate for a 30 year fixed rate mortgage declined 7 basis points since the last week to 4.94% while the purchase application volume declined 7.0% and the refinance application volume increased 1.4% over the same period.

It’s important to recognize that despite the Federal Reserve’s “quantitative easing” measures and record low interest rates, the purchase application volume has now dropped to the lowest reading since 2000.

The following chart shows how the principle and interest cost and estimated annual income required to cover the PITI (using the 29% “rule of thumb”) on a $400,000 loan has changed since November 2006.

The following chart shows the average interest rate for 30 year and 15 year fixed rate mortgages over the last number of weeks (click for larger version).


The following charts show the Purchase Index, Refinance Index and Market Composite Index since November 2006 (click for larger versions).


Thursday, September 03, 2009

Outstanding Contraction!: Commercial Paper Outstanding September 3 2009

The Commercial Paper (CP) market is essentially a private debt market used by corporations as a cheaper means of funding typical recurring operations than drawing on a line of bank credit.

Commercial paper, as financial instrument, is by no means a recent innovation and, in fact, you can read about how the CP market was affected by the many historic financial shocks experienced by the U.S. (read Panic on Wall Street: A History of America’s Financial Disasters)

Although the Federal Reserve was able to artificially bring CP rates down significantly since the shocking 615 basis point spread blowout (A2/P2 spread) of late 2008, they have apparently not been successful in preventing an overall contraction in the CP market.

The Federal Reserve calculates and published the total amount of CP outstanding every week and as of the latest published period, commercial paper outstanding is contracting at nearly the fastest rate on record, registering a whopping 37.87% decline year-over-year.

Another important insight, at $1.162 trillion the total CP market is now 9.46% smaller than the $1.272 trillion seen at the bottom of the last contraction in late 2003.

The CP market that expanded wildly throughout 2004, 2005, 2006 and most of 2007 is now no more, replaced instead by one smaller and contracting faster than at any other time in this century.

Wednesday, September 02, 2009

Reading Rates: MBA Application Survey – September 02 2009

The Mortgage Bankers Association (MBA) publishes the results of a weekly applications survey that covers roughly 50 percent of all residential mortgage originations and tracks the average interest rate for 30 year and 15 year fixed rate mortgages, 1 year ARMs as well as application volume for both purchase and refinance applications.

The purchase application index has been highlighted as a particularly important data series as it very broadly captures the demand side of residential real estate for both new and existing home purchases.

The latest data is showing that the average rate for a 30 year fixed rate mortgage declined 9 basis points since last week to 5.15% while the purchase application volume decreased 1.0% and the refinance application volume decreased 3.1% compared to last week’s results.

It’s important to recognize that while the Federal Reserve’s “quantitative easing” measures held down rates for a time and spurred a notable boom in refinance activity, the recent activity appears to have come to a close.

Even with historically low lending rates both refinance and purchase application volume look to be headed back to the lows of the fall of 2008 and an overall declining trend.

The following chart shows how the principle and interest cost and estimated annual income required to cover the PITI (using the 29% “rule of thumb”) on a $400,000 loan has changed since November 2006.

The following chart shows the average interest rate for 30 year and 15 year fixed rate mortgages over the last number of weeks (click for larger version).


The following charts show the Purchase Index, Refinance Index and Market Composite Index since November 2006 (click for larger versions).


Wednesday, August 26, 2009

Reading Rates: MBA Application Survey – August 26 2009

The Mortgage Bankers Association (MBA) publishes the results of a weekly applications survey that covers roughly 50 percent of all residential mortgage originations and tracks the average interest rate for 30 year and 15 year fixed rate mortgages, 1 year ARMs as well as application volume for both purchase and refinance applications.

The purchase application index has been highlighted as a particularly important data series as it very broadly captures the demand side of residential real estate for both new and existing home purchases.

The latest data is showing that the average rate for a 30 year fixed rate mortgage increased 9 basis points since last week to 5.24% while the purchase application volume increased 1.0% and the refinance application volume increased 12.7% compared to last week’s results.

It’s important to recognize that while the Federal Reserve’s “quantitative easing” measures held down rates for a time and spurred a notable boom in refinance activity, the recent activity appears to have come to a close.

Even with historically low lending rates both refinance and purchase application volume look to be headed back to the lows of the fall of 2008 and an overall declining trend.

The following chart shows how the principle and interest cost and estimated annual income required to cover the PITI (using the 29% “rule of thumb”) on a $400,000 loan has changed since November 2006.

The following chart shows the average interest rate for 30 year and 15 year fixed rate mortgages over the last number of weeks (click for larger version).


The following charts show the Purchase Index, Refinance Index and Market Composite Index since November 2006 (click for larger versions).


Wednesday, August 19, 2009

Reading Rates: MBA Application Survey – August 19 2009

The Mortgage Bankers Association (MBA) publishes the results of a weekly applications survey that covers roughly 50 percent of all residential mortgage originations and tracks the average interest rate for 30 year and 15 year fixed rate mortgages, 1 year ARMs as well as application volume for both purchase and refinance applications.

The purchase application index has been highlighted as a particularly important data series as it very broadly captures the demand side of residential real estate for both new and existing home purchases.

The latest data is showing that the average rate for a 30 year fixed rate mortgage decreased 23 basis points since last week to 5.15% while the purchase application volume increased 3.9% and the refinance application volume increased 5.6% compared to last week’s results.

It’s important to recognize that while the Federal Reserve’s “quantitative easing” measures held down rates for a time and spurred a notable boom in refinance activity, the recent activity appears to have come to a close.

Even with historically low lending rates both refinance and purchase application volume look to be headed back to the lows of the fall of 2008 and an overall declining trend.

The following chart shows how the principle and interest cost and estimated annual income required to cover the PITI (using the 29% “rule of thumb”) on a $400,000 loan has changed since November 2006.

The following chart shows the average interest rate for 30 year and 15 year fixed rate mortgages over the last number of weeks (click for larger version).


The following charts show the Purchase Index, Refinance Index and Market Composite Index since November 2006 (click for larger versions).


Thursday, August 13, 2009

Outstanding Contraction!: Commercial Paper Outstanding August 13 2009

The Commercial Paper (CP) market is essentially a private debt market used by corporations as a cheaper means of funding typical recurring operations than drawing on a line of bank credit.

Commercial paper, as financial instrument, is by no means a recent innovation and, in fact, you can read about how the CP market was affected by the many historic financial shocks experienced by the U.S. (read Panic on Wall Street: A History of America’s Financial Disasters)

Although the Federal Reserve was able to artificially bring CP rates down significantly since the shocking 615 basis point spread blowout (A2/P2 spread) of late 2008, they have apparently not been successful in preventing an overall contraction in the CP market.

The Federal Reserve calculates and published the total amount of CP outstanding every week and as of the latest published period, commercial paper outstanding is contracting at nearly the fastest rate on record, registering a whopping 38.48% decline year-over-year.

Another important insight, at $1.074 trillion the total CP market is now 15.56% smaller than the $1.272 trillion seen at the bottom of the last contraction in late 2003.

The CP market that expanded wildly throughout 2004, 2005, 2006 and most of 2007 is now no more, replaced instead by one smaller and contracting faster than at any other time in this century.