Tuesday, May 17, 2011

QE3, QE4, QE5…

QE3 is in the offing…

Consensus expectations just seems to demand it as a generation of gambling speculators, swindlers, government policy junkies and others with short attention spans and a psychopathic indifference for the soundness of the financial system panic at the least sign of slowdown and line up for another dose of the Feds easy money.

Looking at some of the latest trends, a slowdown of sorts would not be so surprising.

The economy is still being seriously impacted by the evolving housing decline, unemployment remains at 9%, oil prices are near $100 a barrel with gasoline prices reflecting that fact, the Federal Government is toying with the debt ceiling, China is likely overheating as it inches ever closer to parabolic residential real estate prices and likely an ugly crash, other notable leading emerging markets like India and the Russian Federation are continuing to slow, Greece and other European countries are moving closer to debt restructuring… the list of negative externalities runs long yet they all carry the telltale ring of the Great Recession about them.

This is the point at which one, having been schooled by the Fed over many years, must begin to ask the question “What will the Feds response be?”… as if a response by the Federal Reserve is nearly a reflexive action to a consensus expectation of looming slowdown.

The answer to that question should not require such a stretch of imagination… the simple short answer is QE3… no more, no less.

Why would the Fed stop now? Should a slowdown materialize, it will ultimately been seen as an offspring of the Great Recession and treated as such.

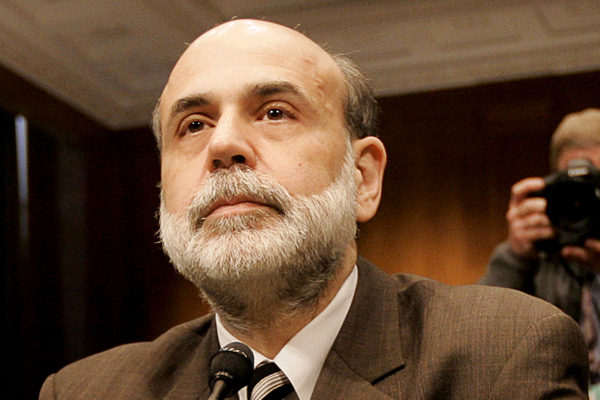
Recognize that during last month’s historic Fed press conference, “Helicopter” Bernanke made no quibble of the fact that the Fed will continue the principle reinvestment function that they have been carrying out ever since they acquired such a sizable bounty of mortgage securities, a clear sign that pumping liquidity is not only the response de jure but the de facto response.

Like a pair of dysfunctional sweethearts, the Fed knows no different course of action then easing and the consensus expects it, so easing it will be.

But as we move further and further from the point where the Feds intervention is viewed as “pump priming” and nearer a more accurate perception of it as the “pump”, one has to wonder when consensus will begin to lose faith and worry that this scheme has no merit.

Only then will we ultimately realize the true consequence of the years of Fed actions.

Production Pullback: Industrial Production April 2011

Today, the Federal Reserve released their monthly read of industrial production and capacity utilization showing slight declines with total industrial production falling 0.01% from March but rising 4.95% above the level seen in April 2010.

Capacity utilization also slowed falling 0.12% from March but climbing 5.10% above the level seen in April of 2010 to stand at 76.91%


New Residential Construction Report: April 2011

Today’s New Residential Construction Report showed a notable declines across the board with with both total and single family permits and starts falling from last month and last year while the new home market remains historically distressed.

Single family housing permits, the most leading of indicators, declined 1.8% on a month-to-month basis to 385K single family units (SAAR) from a lower revised 392K in March, dropping a notable 18.6% below the level seen in April 2010 and an astonishing 78.59% below the peak in September 2005.

Single family housing starts declined 5.1% to 394K units (SAAR), dropping a whopping 30.4% below the level seen in April 2010 and a stunning 78.39% below the peak set in early 2006.

With the substantial headwinds of elevated unemployment, epic levels of foreclosure and delinquency, mounting bankruptcies, contracting consumer credit, and falling real wages, an overhang of inventory and still falling home prices, the environment for “organic” home sales remains weak and likely very fragile.


Monday, May 16, 2011

Forget About DSK... BSB is the Baddest Banker... Dang!

Hong Kong Bubble?: Hong Kong Residential Property Prices March 2011

Today, the University of Hong Kong released their Hong Kong Residential Real Estate Series (HKU-REIS) indicating that, in March, the price of residential properties increased a whopping 4.54% since February climbing 25.46% above the level seen in March 2010.

The “Hong Kong Island” index, “Kowloon” and “New Territories” sub-components also showed stunning monthly and annual increases with the "Hong Kong Island" series indicated that prices have now far outpaced the prior 1997 peak.

The HKU-REIS is a set of property price indices constructed monthly using a “modified” repeat-sale methodology similar to that of the S&P/Case-Shiller indices yet suited to the Hong Kong property market.

Homebuilder Blues: NAHB/Wells Fargo Home Builder Ratings May 2011

Today, the National Association of Home Builders (NAHB) released their latest Housing Market Index (HMI) showing a flat trend for most measures with the "buyer traffic" index remaining near record lows as home builders continue to plod through the weakest activity seen in generations.

It's important to recognize that currently all measures are showing notable declines in the level of activity seen since last year.

Clearly the new home market has seen another no-show start to the buying season with the typically strongest selling months (remember Bob Toll's analysis of the seasons) fully behind it.

The new home market will likely not resume any significant form of healthy function until the considerable overhang of inventory is cleared.


The Empire State Manufacturing Survey: May 2011

The Empire State Manufacturing Survey consists of a series of diffusion indices distilled from a monthly survey of New York regional manufacturing executives and seeks to identify trends across 22 different current and future manufacturing related activities.

Today’s report indicated expansion for current activity but at a slower pace than month while assessments of future activity improved slightly with the current business conditions index falling to 11.88 while the future conditions index increasing to 52.69.

Current prices paid registered a seventh consecutive monthly increase climbing to 69.89, the second highest level seen since the series began in 2001, while current new orders declined to 17.19 with future new orders climbing slightly to 47.31.

Friday, May 13, 2011

Winding Down Fannie and Freddie Starts with Loan Limits

There is probably no better representation of the insanity that swept the nation during the housing mania and just after the collapse than the treatment of the conforming loan limit.

To recap, let’s recall that the “conforming” loan limit sets the maximum loan amount, for which the GSEs (Fannie and Freddie) are allowed to purchase an individual loan.

If a loan is larger than this limit, it is considered a “jumbo” loan and is automatically disqualified from being sponsored by Fannie and Freddie, thus it would have to be handled by the private market (private banks/lenders).

This was a simple enough system whereby one basic piece of underwriting criteria was one of several (there are many other bits of criteria that qualify a “conforming” loan… here we are just concerned with the loan size limit) straightforward qualifying factors dictating whether the government would sponsor a home loan or not.

Now, using the system that was in place before the collapse, this limit would be recalculated once a year using source data from the FHFA… in short, the FHFA would take the October median sales data and use it (along with other procedures) as the basis for the conforming loan limit for the following year.

This meant that, in theory, the conforming loan limits could rise and fall based on the trend of the FHFAs median home price… in theory that is…

Throughout the boom the median prices were rising substantially year after year and, like a good little policy mechanism, the conforming limit was being adjusted up to match the historic run-up in prices and by the peak the limit stood at $417K.

When the housing market soured in 2006 and 2007 though, OFHEO (the Office of Housing Enterprise Oversight… the former regulator of Fannie and Freddie) had to face up to the task of decreasing the loan limit as median prices fell nationwide.

Well, as is typical of this period and of government in general, OFHEO was unable to stand the pressure coming from misguided lawmakers and those with private real estate interests, and simply choose to postpone and decision leaving the conforming loan limit at the prior level.

Then from this point on things really ran amuck… OFHEO came up with a series of haphazard procedures that somehow justified the current limit and stalled further any downward adjustment.

Then, to make matters worse, lawmakers simply refashioned the whole process dismantling the original mechanism entirely and installing a different system whereby a different limit was set for each metropolitan area in the country.

By this point there were areas across the country that had loan limits well over $700K…

So, the dilemma started with OFHEO needing to reduce the limit from $417K and after Washington lawmakers got through with it, the limit was increased to over $700K.

This was a prime example of policy gone wild… While regulators were happy to raise the limit with accuracy each year as prices were rising, they had flatly refused to decrease it as the market soured and finally completely went haywire as the housing collapse stirred panic.

Lawmakers and regulators might say that they were doing the work of the people, stepping in to fill the shoes of a private Jumbo market that refused to lend as the housing market crumbled.

I counter that they worked to encourage the boom by increasing the loan limit (thus pushing up conforming and jumbo loan sizes) continually and supplying endless liquidity for speculators (typical homebuyers and investors) to use to sink themselves in mountains of debt and needlessly inflate the prices of an essential service.

When the market turned, which simply represented reality re-materializing, the housing markets didn’t need more liquidity, they needed less.

The whole public government sponsored scheme of housing debt markets has been an abysmal failure and the conforming loan limit tomfoolery outlined above is but one example of government idiocy run amuck.

The Obama administration is doing the right thing in proposing the winding down of the GSEs and coming out in favor of allowing the elevated conforming loan limit policy to expire this fall.

Lower limits will mean higher interest rates for many homebuyers, particularly those buying homes in excess of $500K, but the intention of the original GSE policy was never to liquefy the top of the market, it was supposed to bring liquidity to the middle class and below.

University of Michigan Survey of Consumers May 2011 (Early)

Today's early release of the Reuters/University of Michigan Survey of Consumers for May indicated an improvement in consumer sentiment with a reading of 72.4 but still remaining 1.63% below the level seen last year while one year inflation expectations declined slightly to 4.4%.

The Index of Consumer Expectations (a component of the Index of Leading Economic Indicators) rose to 67.4, and the Current Economic Conditions Index declined to 80.2.

It's important to recognize that while consumer sentiment is higher than the panic laden trough level seen in late 2008, the current sentiment level is still far lower than any level seen during the 2001 tech recession and roughly equivalent to the worst seen during the early 1990s and second dip 1982 recessions.


Thursday, May 12, 2011

Conspicuous Correlation: Retail Sales April 2011

Today, the U.S. Census Bureau released its latest nominal read of retail sales showing an increase of 0.5% since March bringing the total increase since last year to 7.6% on an aggregate of all items including food, fuel and healthcare services.

Nominal discretionary retail sales including home furnishings, home garden and building materials, consumer electronics and department store sales, on the other hand, declined 0.64% from March falling 1.44% below the level seen in April 2010 while, adjusting for inflation, “real” discretionary retail sales actually declined a notable 4.39% over the same period.

On a “nominal” basis, there had appeared to be “rough correlation” between strong home value appreciation and strong retail spending preceding the housing bust and an even stronger correlation when home values started to decline.

The following chart shows the year-over-year change to nominal discretionary retail sales and the year-over-year change to nominal the S&P/Case-Shiller Composite home price index since 1993 and since 2000.

As you can see there is, at the very least, a coincidental change to home values and consumer spending during the boom and then the bust, but as home values have continued to decline, retail spending has remained low but has not continued to consistently contract.

Looking at the chart below (click for full-screen dynamic version), adjusted for inflation (CPI for retail sales, CPI “less shelter” for S&P/Case-Shiller Composite) the “rough correlation” between the year-over-year change to the “discretionary” retail sales series and the year-over-year S&P/Case-Shiller Composite series seems now even more significant.

Extended Unemployment: Initial, Continued and Extended Unemployment Claims May 12 2011

Today’s jobless claims report showed a notable decline to initial unemployment claims and an increase to continued unemployment claims as a notable rising trend continued to materialize for initial claims.

Seasonally adjusted “initial” unemployment declined by 44,000 to 434,000 claims from last week’s revised 478,000 claims while seasonally adjusted “continued” claims increased by 5,000 resulting in an “insured” unemployment rate of 3.0%.

Since the middle of 2008 though, two federal government sponsored “extended” unemployment benefit programs (the “extended benefits” and “EUC 2008” from recent legislation) have been picking up claimants that have fallen off of the traditional unemployment benefits rolls.

Currently there are some 4.10 million people receiving federal “extended” unemployment benefits.

Taken together with the latest 3.76 million people that are currently counted as receiving traditional continued unemployment benefits, there are 7.87 million people on state and federal unemployment rolls.


Beveridge Curve Balancing Act: March 2011

Looking deeper at today’s Job Openings and Labor Turnover report you can see that while the unemployment rate is showing notable signs of establishing a peak, the job openings rate is showing an equal but opposite troughing dynamic.

Further, the latest data indicates that private job hires are occurring at a rate of 3.5% of total employment while private job separations occurs at a rate of 3.3%.

So, currently job hires are slightly outpacing separations thus resulting in, more or less, a stagnant job market and more evidence that the unemployment rate may stay elevated for some time.

It's important to note that today's data is very preliminary and volatile and that a more sustained and sustained spread between the rate of hires and separations would be required to make a significant dent in our current structurally weak job market.

Economic Jolt: Job Openings and Labor Turnover March 2011

Today, the Bureau of Labor Statistics released their latest monthly read of job availability and labor turnover (JOLT) showing that private non-farm job “openings” increased 2.78% since February climbing 23.22% above the level seen in March 2010 while private non-farm job “hires” increased 1.39% from February and 0.48% above the level seen in March 2010

Job “layoffs and discharges” declined 0.13% from February while dropping 9.46% below the level seen last year while quitting activity continues to climb increasing 2.01% from February and 8.67% above the level seen in March 2010.

It’s important to understand that job “quits” are included as a component of the “separations” data series as “quitting” is a valid means of workers “separating” from employers but their inclusion tends to create an overall procyclical trend in what would otherwise be logically thought of as a countercyclical process (i.e. downturn leads to increase in separations not decrease).


On The Pulse: Ceridian-UCLA Pulse of Commerce Index April 2011

The latest release of the Ceridian-UCLA Pulse of Commerce Index™ (PCI) suggests that economic activity slowed slightly in April with the seasonally adjusted index declining .50% from March but remaining 3.45% above the level seen in April 2010.

Further, the three month moving average of the PCI continued to climb from March indicating that the March (next week) Industrial Production data will likely show a similar trend.

Chief PCI Economist Ed Leamer calls the latest trend "wobbly and muted" and suggests that while growth is still occurring, the trends are weak.