Thursday, October 12, 2006

Beige Thursday

Today the Federal Reserve Board released its almost monthly “Beige Book” report for October, which presents an anecdotal summary of economic conditions in each of the twelve Federal Reserve Bank districts.

Somewhat surprisingly, this edition shows significant slowing, even increasingly slowing conditions for residential real estate and construction activity in NEARLY EVERY district.

Reading each districts report one after another, its becoming increasingly clear that this housing downturn is truley a "national" phenomena.

So it seems that Chairman Bernanke’s assessment of “significant” slowing in the housing sector having the effect of trimming 1% off of GDP may be more accurate than the “Greenspan Bottom” theory.

The following are excerpts from each district report:

Boston

Across New England, the pace of residential sales continues to be slow compared to 2005. In Massachusetts, the average number of days on the market has increased by a full month since last year, to around 110 days. Contacts attribute slower sales to less urgent buyers focused on getting the highest value for their money. Slow sales combined with increased listings have led to inventory build-up in most New England markets. In Massachusetts, single family inventory has increased 16 percent and condominium inventory has increased 28 percent year-on-year, leading to around 10 months of supply currently in the market.

Contacts indicate that as sellers have become more attuned to supply conditions in recent months, they have become more willing to reduce prices. Correspondingly, many New England markets feature declining prices. The median price of single-family homes sold in Massachusetts in August was about 6 percent below its August 2005 level; the corresponding decline for condominiums was 3 percent.

Contacts expect that the pace of sales will remain slow in the near term and that markets will continue to show prices below year-earlier levels.

New York

The region's housing market has shown mixed results since the last report, with further weakening noted in northern New Jersey and upstate New York, but signs of underlying strength reported in New York City. New Jersey homebuilders report that the housing market has continued to slacken since the last report: both buyer traffic and sales activity have declined substantially, the inventory of homes on the market has risen substantially, and prices have continued to slip. One New Jersey contact also notes pronounced weakening in the sub-contracting business, attributing much of the recent weakening in home remodeling to reduced home equity. Similarly, real estate firms in western New York State report that both sales and prices were down moderately in August, compared with a year earlier.

Philadelphia

Bankers in the District expect business and consumer lending to increase in the months ahead, but not strongly. They also expect gains in credit card lending. However, they anticipate a further decline in the demand for residential mortgages. Some bankers also said they expect an increase in mortgage delinquencies as payments of principal start to become due on non-amortizing mortgages and as rates rise on adjustable-rate mortgages.

Cleveland

Residential contractors reported new home sales are down or flat when compared to earlier this year. Year-over-year sales declines of 10 percent or more are common with a few contacts saying the market is down by as much as 60 percent. Several contractors reported that they no longer have any backlog. Most home builders expect sales to remain soft for the remainder of the year with 2006 totals to be below those in 2005. Many contacts said that material costs have stabilized over the past couple months with a few noting a drop in the price of lumber. About half the homebuilders contacted reported reducing their labor force through direct layoffs or by not replacing workers that leave.

Richmond

Residential real estate agents across the District noted generally slower home sales in September. A Washington, D.C., agent described that area's housing market as "horrible," adding that sales volume was down 25 percent from a year earlier. Additionally, he reported that home inventories had risen sharply and that some sellers were trimming asking prices. In Virginia Beach, Va., an agent also noted weaker home sales, saying that buyers were being more selective. Many District agents told us that inventories in their housing markets continued to rise and that buyer traffic had slowed. Modest decreases in home prices were noted by contacts in many areas, and an agent in Richmond, Va., told us that sellers were offering more incentives to prospective buyers.

Atlanta

Slowing loan demand, aggressive competition for deposits, and strong credit quality, characterized reports from the District's banking sector in September. Weaker real estate loan demand was noted in most parts of the District, while reports on commercial and industrial lending were softer than in the last report. Higher foreclosure rates were reported in parts of the region as increased interest rates affected borrowers with adjustable rate mortgages. However, bank credit quality indicators remained strong.

Chicago

Residential construction and real estate activity declined again in most areas. Homebuilders observed sluggish demand in all market segments, and a Chicago-area builder said high-end properties have been taking noticeably longer to sell.

Builders in southeast Michigan reported a number of project cancellations. New home prices were steady to down, and several builders were adding free upgrades to help sell homes. A contact in Michigan noted that list prices of existing homes were being reduced as well.

St. Louis

August year-to-date home sales declined about 2 percent in both St. Louis and Little Rock. Residential construction remained weak throughout the District. August year-to-date single-family housing permits were down in nearly every metro area. Compared with the same period last year, permits fell 34 percent in Louisville, 21 percent in greater St. Louis, 11 percent in Memphis, and 8 percent in Little Rock.

Minneapolis

Residential real estate continued to slide. August home sales in Minneapolis-St. Paul were down 27 percent from 2005, with pending sales down 23 percent. Sales were down 10 percent from last year in the Upper Peninsula of Michigan; the market for recreational land is the only strong segment there.

Kansas City

The residential real estate market continued to soften while commercial real estate activity expanded. Contacts indicated that home starts, traffic of potential buyers, and home prices were down relative to a year ago. Inventories of existing homes rose and contacts reported that the time-on-market for homes lengthened, despite the increased use of concessions to attract buyers. Home sales were soft in most segments of the housing market, with particular weakness in low to moderately priced housing markets.

Dallas

The housing market continues to soften but remains quite strong. Sales are particularly strong in Houston, Austin and El Paso. Dallas real estate agents say the "buying fervor" is a little slower, but relocations and healthy job growth are still boosting activity. New home inventories have inched up, despite strong demand in some markets. Building is expected to slow from the rapid pace of growth seen earlier this year. While the market remains strong, contacts have become "more nervous and anxious" in their outlook, especially given recent reports of a decline in housing sales and prices at the national level.

San Francisco

Demand for residential real estate fell further in most areas, while activity in commercial real estate markets continued to expand but at a slower pace than previously in some areas. The pace of home sales, construction, and price appreciation slowed further in most parts of the District, and contacts in some areas noted that developers have been offering price concessions and other incentives to entice buyers.

Wednesday, October 11, 2006

National Housing Bubble?

There has been a long standing belief (or at least a widely publicized talking point) by some economic bulls, particularly those in the real estate industry, that there can be no national housing bubble because there is no national housing market.

Trailing that supposition is usually the minor disclaimer that of course there are many regional markets that could very well be experiencing bubble like conditions.

Granted, the nations housing market is clearly an aggregate of several hundred regional markets many of which historically have never even exhibited cyclic price movements.

Yet, something about the argument seems to fall flat.

Could it be the way the “raging” real estate bulls such as David Lereah or Barry Habib use this simple line of reasoning all the while employing a host of national statistics to support their notion that the real estate market is “stabilizing” and will inevitably experience a “soft landing”?

How can you have it both ways?

If you discount the possibility of a national housing bubble based on the mere fact that housing is regional then how can you support the idea of price stability in the housing market by citing national statistics.

Let’s make it even simpler. If there is NO national housing market, than what good is looking at the national median home price statistic? That indicator has very often been cited by real estate bulls as an overall measure of the stability of the housing market.

How about pending home sales, housing starts or the myriad of other national real estate statistics?

The point is, if you’re not willing to accept the idea of the national market exhibiting a trend in the negative direction than the same has to apply for trends in the positive direction as well.

The key here lies in trying to establish the extent to which the country, in terms of its regional markets, is actually experiencing a housing bubble and to determine how many people and homes in those areas may be effected.

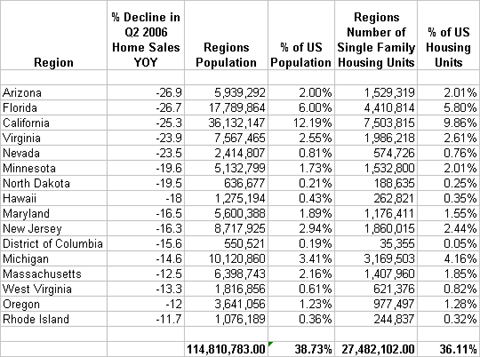
In an effort to gain some perspective lets look at the following sheet which lists some simple metrics for the current 16 top declining housing markets in the US.


Each listed region shows a double-digit decline in year over year, Q2 home sales.

The population living in these regions total 114.8 million or roughly 38.7% of the total US population.

The number of single family units in these regions total 27.5 million or roughly 36% of all single family homes in the US.

Keep in mind that the areas listed were only the “Top 16” out of an total of 28 states and the District of Columbia that showed declining sales in Q2 2006.

So as you can see, no matter how you look at it, nationally or regionally, the current housing slowdown is effecting a significant percentage of the US by population and by housing stock. In fact, so much so that we may soon see one or more months of declines to the national median home price, an event that has not happened since the Great Depression.

Tuesday, October 10, 2006

Greenspan: “… the worst of this may well be over”

For those of you that may not have seen the latest news, former Federal Reserve Chairman, Alan Greenspan, has indicated that he believes the worst may be over for the housing downturn.

“I suspect that we are coming to the end of this downtrend, as applications for new mortgages, the most important series, have flattened out,”

“There is a good chance of coming out of this in good shape, but average housing prices are likely to be down this year relative to 2005. I don't know, but I think the worst of this may well be over”

Not surprisingly, “analysts” across Wall Street have picked up on his comments today and issued a slew of “Buy” ratings for many of the largest home builders.

The “air” of CNBC is filled with giddy talk of reaching the “bottom”!

Rather than go on with a lengthy discussion, Id like to remind you what Greenspan stated last May while attending a Bond Markets Association dinner:

"This has been quite an extraordinary boom…. home sales are off, applications are off, everything is going in the same direction. The boom is over, and you can say that with a fairly strong degree of confidence."

As well as what Bernanke said just last week:

"[The US housing market is undergoing] a substantial correction… Weaker housing likely will shave about one percentage point from gross domestic product growth in the second half of 2006,"

So, who’s right? Greenspan back in May and Bernanke now or the current Greenspan?

You tell me! Leave your comments below...

Friday, October 06, 2006

Internal Hovnanian Memo...


This memo was released recently and has been circulated on the internet today. Apparently, its lagit and sheds quite a bit of light on the state of the homebuilder and the industry in general.

K. Hovnanian memo to employees

Sent: Tuesday, October 03, 2006 10:02 AM
To: DL HOV Associates
Subject: TO ALL HOVNANIAN ASSOCIATES
Importance: High

PLEASE DISTRIBUTE TO THOSE ASSOCIATES WHO DO NOT HAVE ACCESS TO EMAIL.

MEMORANDUM TO: All Associates
FROM: Ara K. Hovnanian
DATE: October 3, 2006

Fellow Associates,

A few months ago I wrote to you about the changing market conditions in our industry and our concerns about how long the downturn in homebuilding may last. Since that time, the market has slowed further still, representing one of the steepest declines in new home sales in our memory. Most of our markets have been affected, some severely. At this point, we are preparing for a long period of slower sales, at least through 2007 and perhaps beyond.

What does this mean for you and for our Company? These new market conditions have affected us in many ways and will continue to affect us in the months ahead. In the area of land acquisition we have been re-evaluating our current land positions and the contracts for new land in the light of these new conditions. Many of those contracts no longer make good financial sense when you factor in lower prices and a slower sales pace. In cases where we have been unable to renegotiate these contracts with more favorable terms, we are canceling them, at times forfeiting our deposit monies. It is important to state that in all cases where we have canceled contracts, we have acted legally and with integrity, adhering to the very specific terms of those contracts and exercising previously agreed-upon terms of cancellation. We continue to have an ample supply of land for our future growth, but we need to be sure that the communities we develop can be profitable.

Our local and national Purchasing teams have been pro-actively working with our service providers, material suppliers and trade partners to find ways to reduce our costs, through better pricing, defect reduction and product specification changes. We have been successful in many of our Business Units in finding significant cost reductions through cooperation with our business partners. We continue to work on ways to reduce costs.

We have also had to make adjustments to our pricing in order to make sales, either through added features, free options, waived premiums or outright base price reductions. In a market where our competitors are making dramatic pricing concessions, we must make similar adjustments in order to remain competitive. Obviously, this has a significant impact on our profits on those homes that we sell at a discount.

The most difficult adjustment we have had to make to the changing market is in the area of staffing. In many locations, including corporate headquarters, we have been forced to face the fact that we no longer have enough work for all of our Associates. We were hoping that normal attrition and a reduction in new hires would prevent us from needing to take further action. Those steps helped, but did not solve the problem of having too little work for our entire team. As a result, we have had to make staff reductions.

We consider this action to be a last resort, but business realities demand action in order for our Company to remain healthy and to maximize our performance in a difficult market environment. We know that this causes pain not only for the families of displaced Associates, but for our remaining Associates as well. In all cases, we are treating our displaced Associates fairly and with dignity. We are providing severance and outplacement services where they are available. There may need to be more adjustments if the market continues to slow. We will make those decisions with great care and sensitivity and we will try to keep you well informed of any changes.

What can you do to help us continue to prosper during these challenging times? First and foremost, you can continue to focus on delighting our customers. Companies with “raving fans” prosper during good times and bad. We have made great improvements in this area, but we have much room for continued improvement. Regardless of the market conditions, we will continue to invest resources and support to further our goal of being an industry leader in customer satisfaction. Don’t let a soft market deter you from doing everything you can to create a great customer experience.

Second, you can help us to eliminate waste and rework, which costs our Company literally millions of dollars each year, by focusing on process improvement and defect and error reduction. Help us to eliminate unnecessary costs by spending our money wisely. Here at Corporate headquarters, we launched a “great idea” program where Associates submitted nearly 200 ideas for cost savings, generating the potential for huge savings. In just one example, our new contract for overnight shipping services in switching to DHL will save us up to a million dollars annually! There are many such opportunities all around our Company and we need you to help us identify them.

Finally, you can continue to do the great work you do for our Company every day. Challenging times allow the best and the brightest to truly shine. We have a lot of work to do and thousands of homes to sell, build, close and service. We all need to keep our heads down and get the job done, every day.

As always, and for good reason, I remain highly optimistic about the future. Our Company is very strong financially. With $1.5 billion in our credit facility, a strong cash position and $2 billion in shareholder equity, we have the capital resources needed to weather the storm and to position ourselves to take full advantage of the opportunities that markets like these always present. The market will gain strength eventually, and we will be poised and ready to take full advantage of it. We will emerge from this market stronger and better.

Thanks to each and every one of you for all you do to help us become THE BEST homebuilder in the nation.

Concocting a Better Bubble

For those of us who concern ourselves with every little twist and turn of the ever-changing state US housing market, it can be easy to loose perspective and conclude that everyone else interprets the data similarly.

In fact, though, nothing could be farther that the truth. At every turn there seems to be some willing to ignore what would seem like fairly substantial evidence that things are awry, in favor of some “reinterpretation” or otherwise “new era” view of things.

In March of this year, a husband and wife team of Gary and Margaret Hwang Smith, two professors of economics from Pomona College presented a paper at the Brookings institute entitled “Bubble, Bubble Where’s the Housing Bubble”. The paper, subsequently being widely read and reported on after landing on the front page of the New York Times, presented a new analysis of housing that would seem to all but eliminate the possibility that housing bubbles were occurring, even in some of the most active and “frothy” markets.

"Most of the country is certainly not in a bubble if you define a bubble as prices far above fundamentals," said Gary Smith, who is the Fletcher Jones Professor of Economics at Pomona College. "The average person in the U.S. is still better off buying than renting."

More recently, two Congressional economists made similar arguments in the spring 2006 edition of widely read quarterly journal.

In the article entitled “A Collapsing Housing Bubble?”, Ike Brannon and Suzanne Stewart, who are apparently members of the staff of Senator Orrin Hatch, skillfully present several arguments that seem to dispel the possibility of a housing bubble.

Particularly notable was the presentation of the ratio of “owners equivalent rent” to two different home prices indexes.

Arguing that the Office of Federal Housing Enterprise Oversight (OFHEO) Home Price Index over-represents the impact that home improvements have on the accuracy of such a ratio, the authors offer an alternative home price index to base the analysis.

Claiming that the Census Bureaus “Constant Quality Index”, an index that attempt to track home prices of “equivalent quality” homes over time, would be a better fit for such analysis, the authors produce a chart which would have one easily concluding that there is no significant discrepancy between rents and home values thus bubble fears are overdone.

Trouble is, they forgot to mention that the “Constant Quality Index” has many significant flaws in its formulation not the least of which is that it tracks a mere 14000 homes compared to the 32 million homes accounted for by the significantly more widely accepted OFHEO House Price Index.

The paper goes no to describe two significant benefits of the “interest only loan” finally concluding with the following prophetic quote:

“With no specter of inflation in our future and a world of relatively low returns, investing more in a house makes perfect sense. A stagnant stock market does not send off the siren song to investors that it did a decade ago. Who is to say that in such an environment a family spending another $100,000 on a nicer house is not making a wise decision?”

Now, with housing sales in 28 states and the District of Columbia in full decline and prices starting to follow suit, one wonders how sensible it was to formulate and widely distribute such imaginative papers.

Wednesday, October 04, 2006

“First… the good news”

In keeping wither their recent “spin the dirty laundry” approach to public affairs; the National Association of Realtors has produced a fairly comprehensive “market by market” home price analysis for 119 of the nation’s largest metropolitan regions.

Each individual metro report contains sections dedicated to local price activity, affordability, home sales, mortgages trends and fundamentals as well as a final “Risk Factor” summarization and “Pricing Scenarios” predictions.

In typical fashion, NAR tries in earnest to present the data in its most positive light spinning some significant indicators of the market instability with fine tuned hocus pocus.

In the section dedicated to affordability, they suggest that home prices, having significantly outpaced incomes in recent years, results in a price-to-income ratio that is often cited as an implication of a housing bubble. Each report then goes on to suggest that since mortgage interest rates have been at historical lows, a more relevant ratio to analyze in determining the existence of a bubble would be the ratio of “median mortgage servicing” cost to “median income”.

Certainly, this classic “it’s not how much it costs that matters, its how much you can afford” logic makes things look significantly better as you ignore the fact that the overall debt burden has just doubled (or more) and instead focus on the cost of just the loan payment relative to the current income. Not to mention that many markets show absurdly high percentages of ARM loans so the servicing costs are likely to be increasing soon.

Additionally, the “Pricing Scenarios” section attempts to mask the very real scenario whereby just a 5% drop in home prices puts the majority of the metro areas 2005 home buyers into negative equity. NAR terms this grim scenario “equity loss”.

Each report then closes with a five point sales pitch on the tax benefits of owning a home, why homes are not like other equities (i.e. cant trade like stocks so doesn’t show the same volatility) and the fact that national median prices have not declined since the Great Depression.

Arguably, the most interesting statistic disclosed by the reports are simply the sheer number of metros exhibiting the obvious signs of the asset run-up as wells as the now prominent slowing to decline.

Second best might be the unbelievable percentage share of ARM loans that have been used to finance homes. Most metros will show 20-30% with some, such as Las Vegas, showing a whopping 58% of all loans being ARMs.

Monday, October 02, 2006

A Stable Decline

Yesterday, the National Association of Realtors released its August Pending Home Sales” report which showed that nationally, pending home sales had edged up 4.3% as compared to July.

The National Association of Realtors developed the “Pending Home Sales” index as a leading indicator based on a random sampling of roughly 20% of the month’s transactions for exiting home sales and indexed to the average level of contract activity set during 2001.

In an effort to use any “positive” numbers as a means of reassuring hesitant buyers, David Lereah, NAR’s Chief Economist states in a release titled “Pending Home Sales Index Shows Market Stabilizing”, “Our sense is that home sales may have reached a low in August – the Pending Home Sales Index shows home sales should be fairly stable over the next two months, although a minor decline is possible”

As usual, looking more closely at the results one might draw a less optimistic conclusion:

- Nationally the index was down 14.1% as compared to August 2005

- The Northeast region was down 12.4% as compared to August 2005.

Additionally, August marks the third consecutive month that this region has registered activity BELOW the average activity recorded in 2001, the first year Pending Home Sales were tracked.

- The West region was down 16.9% as compared to August 2005.

- The Midwest region was down a whopping 20.4% as compared to August 2005.

Additionally, August marks the second consecutive month that this region has registered activity BELOW the average activity recorded in 2001, the first year Pending Home Sales were tracked.

- The South region was down 9.4% as compared to August 2005.

So it appears that, year over year, contract activity is dropping rather sharply with the Midwest and the West regions now showing significant declines.

So much for pending contracts pointing to further “market stabilization”.

Bubble Times

Want a single point of entry for daily housing and economic related news with an emphasis on the housing bubble that’s updated every 10 minutes?

I give you… The Bubble Times!

This page acts as a “filtered” news aggregator, filtering articles from over fifty news feed sources.

Currently, Articles get categorized into either “U.S. National”, “U.S. Metropolitan”, “International” or “Blog” sections and are further “ranked” by the number of “clicks” each receive.

Additionally, all posts from top housing bubble and economic Blogs are included, unfiltered, in the “Blogs” section providing a single space to browse the bubble blogesphere.

Over time, I'll be adding MANY more sources as well as better targeting the filters in order to present the most relevant news items.

Also, I’m hoping to improve the formatting to allow for the most pleasant reading experience.

As usual, let me know if you have any comments or suggestions. Especially helpful would be suggestions for regional news sources, favorite Blogs, as well as preferred article formatting.

Friday, September 29, 2006

Bubble News Network

In an attempt to become the “Ted Turner” of the Housing Bubble Blogesphere I give you BNN! The Bubble News Network!

Like the tagline says… BNN is the “Most Trusted Name in Bubble News”.

Seriously, I needed a place to put all the videos I’ve been accumulating recently so I created a simple broadcast page that will host a full schedule of streaming video clips.

You can surf to the page and simply start watching the current scheduled broadcast or browse the clips and select the one you would like to see first.

In any case, the page continues to stream from wherever you started.

I’ve noticed that the page looks a little better using IE but Firefox seems to work reasonably well too.

Current there are 5 hours of clips but that list will surly be growing fast. Keep checking back as Ill be adding many clips from CNBC, CNN, FOX etc.

I’ve recently added two clips of David Lereah and Robert Shiller on both CNN and The NBC Nightly News.

As usual, be sure to let me know if you experience any problems while viewing the broadcast.


Thursday, September 28, 2006

Barry Habib Advocate of “No Housing Bubble”

NOTE: The video links below are a MUST WATCH for anyone that truly wants better insight into how the housing run up got so out of control.

Yesterday afternoon, CNBC aired a segment which featuring Barry Habib, President and CEO of an organization called “The Mortgage Market Guide”.

Watch the streaming video here: There Is No Bubble

Apparently, this wasn’t his first televised appearance either, as Habib has been a regular guest on CNBC as well as being frequently featured on other widely viewed cable and broadcast channels.

During the segment, Habib’s outlook, as well as his blatant and seemingly disingenuous disregard for the obvious declining state of housing, provided a stark reminder that many “analysts” have a significant interest in attempting to convince others to ignore the facts going on around them.

Like others in his camp, Habib chooses to conveniently protest the existence of a housing bubble at the national level. This is an important caveat as, even given the current, unprecedented run-up in home prices; the case for a bursting national housing bubble is not as easy to make as it is for some of the “red hot” individual markets.

The national housing market is really just a collection of hundreds of regional and local housing markets, many of which experienced only moderate appreciation over the last 10 years. So, national numbers, essentially being national averages, tend to show more moderate growth and more limited declines resulting in what would be considered non-cyclical trends... i.e. generally speaking no booms or busts.

That being said, the National Association of Realtors recently announced that 28 states and the District of Columbia are now experiencing declining home sales. It may not be long before those states register a decline in median home prices as well and then, possibly, a truly national housing bust would be more of a reality.

In any event, the numerous “metro” housing bubbles are a firm reality anecdotally and statistically and, given their sheer number and the number of people that will be affected by their decline, you can be sure the U.S. is in for some rough waters ahead.

So, should a “veteran analyst” doubt your claim of a bursting national housing bubble, instead ask him how he feels about the bursting bubbles in Boston, Washington DC, Miami, Tampa, Chicago, Phoenix, San Diego, New York, Los Angeles, Honolulu, Seattle, Sacramento, San Francisco, etc. etc… you get the picture.

P.S. For those of you interested in watching Habib’s prior appearances on CNBC I have compiled the videos below. Particularly notable is the segments in which Habib encourages others to get “Screaming Bargain” ARM loans!

  • “A Call To ARMs” - August 8, 2004

    Barry explains how adjustable rate mortgages are a “screaming bargain”! Additionally, Barry challenges the mindset of real estate agents, mortgage professionals and consumers who inherently assume that fixed rate loans are the way to go.

  • “Velocity of Money” – October 7, 2004

    Barry encourages others to increase their mortgage debt burden as an arbitrage investment. Barry says “if you need a 100K mortgage… consider taking instead a 300K mortgage” then invest the excess money and after 30 years BINGO!! You have an 800K “nest egg”!

  • “Profiting from the Fed”– February 3, 2005

    Barry explains how you can avoid PMI by either getting a “piggy back” loan or better yet get “Magic” loan insurance from MGIC. Barry suggests that ARMs are a “great alternative” to fixed rate loans.

  • “Four Questions for Mortgage Brokers” – April 7, 2005

    Barry explains how to determine if your mortgage broker is legitimate by asking four simple questions.

    Also, predicts that rates will increase only 1/2% in 2005 which is no problem as there will be no “housing bubble” and the increase only equates to $8 a month to the average home buyer.. so “give up a couple of lattes and buy the house you want”.


  • “Buy vs. Rent… No Housing Bubble” – June 2, 2005

    Barry states that he is the “advocate” of “no housing bubble”. Again, he suggests that any up-tick in rates will only equate to an additional $8 a month for the home buyer.

    Barry suggests that renting is giving up the opportunity to make $85K in appreciation.

    Additionally, Barry suggests that you think twice about all the speculation of “housing bubble” since if it prevents you from buying, you might “miss out”.

    Barry also suggests that “interest only loans” are “OK”.


  • “Realty Check” – June 21, 2005

    Now suggests that you “have to be careful” with interest only loans… “they are not for everybody”.

    He goes on to state that he’s not a fan of “negative amortization” loans but “however, it can be a great thing for people who are expecting their income to go up”.


  • “Ask Barry” – September 28, 2005

    States that a quick rule of thumb is that a household should “forget what the bank says” and allocate up to 50% of “after tax” income to their mortgage debt burden.

    Goes on to state that a Florida real estate speculator feel secure that Florida is #1 in the country in job growth an should expect merely a slowdown in appreciation if rates increase.
    Additionally, suggests that an “Option ARM” could be a “great tool” as long as the borrower is disciplined.


Wednesday, September 27, 2006

Today’s New Home Sales Report

Today, the U.S. Census Department released its monthly “New Residential Home Sales” report for August causing a flurry of optimism in the traditional business media.

It was speculated that the reports results, showing a 4.1% increase in sales as compared to July’s number, might help to propel the DOW, opening just 35 points away from its all time high, into record territory.

Typically, the bulls on Wall Street seem to be latching on to any positive news that might substantiate their hopes that the housing downturn is setting a bottom and will not present a dramatic impact to the economy but rather, a “soft landing”.

As usual, it’s this overly optimistic and myopic vision that seems to prevent general discourse on the realities of the current housing decline.

The fact is, July’s national new home sales number was revised down 5%, yielding a more dramatic percentage change to the August number which will, in all likelihood, be revised down as well.

Additionally, look at the other numbers found in today’s report:

National

  1. New home sales were down 17.4% as compared to August 2005.
  2. The number of new homes currently for sale increased 19.1% as compared to August 2005.
  3. The number of months’ supply of the new homes has increased 43.5% as compared to 2005.

Regional

  1. The West was down 17.7% as compared to July 2006 and down 34.7% as compared to August of 2005.
  2. The Midwest was down 19.6% as compared to August 2005.
  3. The South was down 10.2% as compared to August 2005.

Monday, September 25, 2006

Home prices are being SLASHED! In Massachusetts

Ouch! You can chalk another mark up in the column of total housing collapse in Massachusetts.

Homeowners were slashing prices in August faster than Lizzie Borden on late summer bender!

Or as Timothy Warren Jr., CEO of The Warren Group more aptly puts it:

"The August numbers show that the market slowdown is taking hold and shows no sign that it is going to turn around anytime soon,"

"We are clearly going through a market correction that is long overdue, considering the 10 years of unbridled sales and price increases Massachusetts has experienced.”

As with past months, there are two sets of numbers to look at for Massachusetts.

First, you have the Massachusetts Association of Realtors (MAR) numbers that track ONLY homes listed on the MLS system. Consequently, the MAR numbers result in a slightly inaccurate picture since they don’t account for all the “For Sale by Owner” and other non-MLS home sale transactions.

For a more comprehensive view there are the numbers produced by The Warren Group (WG) which are based on actual deed transactions which present a more complete view the market.

Again, like last month, we have to keep in mind that we are coming off of an historic run-up in home prices fueled by a frantic speculative madness that had captivated our area for almost ten years.

As in months past, be on the lookout for the inflation adjusted charts produced by BostonBubble.com for an even more accurate "real" view of the current market trend.

Key Statistics for August 2006

  • Single Family Sales Down 21.6% (MAR), 19.8% (WG) as compared to August 2005

  • Single Family Median Price Down 6.1% to $352,000 (MAR), 8% to $331,000 (WG) as compared to August 2005

  • Condo Sales Down 18.5% (MAR), 19.3% (WG) as compared to August 2005, the largest drop since 1995.

  • Condo Median Price Down 3.3% to $278,000 (MAR), 5% to $276,000 (WG) as compared to August 2005

  • Single Family average “Days on Market” stands at 109 days in August as compared to 77 days for August 2005

  • Condo average “Days on Market” stands at 108 days in August as compared to 77 days for August 2005
Key Facts
  • August marks the fifth (MAR), seventh (WG) consecutive month of of year over year declining single family home sales for a total of 18 declines in the last 19 months.

  • Inventories have now risen for 18 consecutive months.

  • Boston leads the nation in price reductions with 46.4% of homes listed on the MLS having been reduced.

  • Residential housing (homes and condos) inventory has increased 20% over the past 12 months.

Saturday, September 23, 2006

Welcome Correction

At this point, it seems the National Association of Realtors Chief Economist David Lereah can’t distance himself fast enough from this historic housing bust.

One has to wonder whether this about face is a late in coming acceptance of the unreasonable factors that have led to the housing bubble or simply a means of covering the tracks of prior statements.

In his latest article written for Realtor Magazine Online, Lereah “Welcomes the Correction” with the following statements:

“Prices in many of those markets are still up, though, in some cases by double-digit percentages. But in the not-too-distant future, they should start falling—and that’s not a bad thing.

“… we need cooling prices today to give buyers a chance to get back into the market.”

Additionally, in the latest issue of “Real Estate Insights”, Lereah makes some truly astounding statements especially compared to his prior hyper-bullish sentiment:

“The U.S. housing sector has entered uncharted territory. Despite historically low mortgage rates and a growing economy, it is contracting. What is going on here?

This market anomaly is defying the lessons of Economics 101. For the past century, every major downturn in the housing sector has been attributed to rising interest rates and a sluggish economy”.

“…. But low-cost financing and jobs are plentiful today -- both 30-year mortgage rates and the nation’s unemployment rate are hovering near historic lows, about 6.6 percent and 4.7 percent, respectively. Meanwhile, the housing market is cracking.”

“…The good news is that prices are beginning to soften. Price growth (year over year) turned negative in the West and Northeast regions of the nation during July. Hopefully, this trend can continue for the next several months.“

“So prices now need to take center stage. Sellers need to abandon unreasonable expectations about the value of their homes.

“Most homeowners today have enjoyed substantial equity gains on their properties during the real estate boom years. Cutting prices by 5 or 10 percent will not wipe out their home equity gains.”

“Only price reductions can bring confidence back to the market. So let’s give a round of applause for prices taking center stage for a brief turn. The sooner home prices drop, the sooner we can stop the bleeding.”

“Expect home prices to fall for most of the remainder of this year. Although it may seem to go against your better judgment, this is a good thing for the long-term health of housing.”

Now, contrast those statements with the following excerpt taken from David Lereah’s book entitled “Why the Real Estate Boom Will Not Bust - And How You Can Profit from It: How to Build Wealth in Today's Expanding Real Estate Market” published in February 2006 (yes.. just this last February):

“Why do I believe that the real estate boom will continue into the next decade? While many real estate watchers like to attribute the boom to low mortgage rates, that is only part of the story. And even if mortgage rates notch up a percentage point or two, they will still remain historically low. What are the other factors at work? First, technological advances such as automated underwriting and internet-driven home listings have reduced home ownership costs and simplified the process with which houses are bought and sold. Most important, a continued high level of demand for homes by baby boomers, their children, and new immigrants buying their first homes helps to ensure that the boom will continue into the next decade. There is no real estate “price bubble.” The long-term fundamentals for housing remain excellent for the foreseeable future.”

Remember, this is the same man that only just last year, labeled a number of leading economists, including Robert Shiller of Yale “Chicken Littlels”.


Friday, September 22, 2006

Back to the Future

Back in early 90s the nations housing market seemed pretty dreary. After having boomed for the better part of a decade, many of the hottest markets peaked in the late 80s and were firmly in recession by early 1990.

By that time, buyers had become significantly more cautious and housing inventories had grown to levels exceeding that of the last major housing correction.

In the end, the downturn would last longer than most had predicted with many areas bottoming out in the mid-90s and taking until 1997 for most areas to surpass the peak prices.

The following article, published in The Post-Standard (of Syracuse NY) dated January 16, 1991, chronicles the activities taken by the National Association of Realtors in an attempt to spur on buyers.

Notice some of the interesting similarities between the events chronicled in this article and the predicament we find ourselves in today.

Note also, that John Tuccillo, who then held the position of Chief Economist of the National Association of Realtors, seemed to be (from various quotes published at that time) substantially more measured in his approach as compared to the current bearer of that title.

If you’re interested in knowing what Mr. Tuccillo thinks about the current housing bubble read his blog.

Everything in Place but Buyers
By ALBERTO BIANCHETTI
The Post-Standard -
January 16, 1991

On paper, with selection high, prices stabilizing and interest rates at a decade long low, this should be a great time to buy a house, the National Association of Realtors' top economist said Tuesday.

But, in reality, those sound facts have been overcome by widespread uncertainty by buyers. "Everything is in place, but what is not there is the buyers," said John A. Tuccillo, chief economist and senior vice president for the National Association of Realtors. "They are not there for two reasons. They don't know what is happening

in the economy and they don't know what is happening politically."

Tuccillo was in Syracuse to help the Greater Syracuse Association of Realtors kick off an advertising campaign designed to help boost a flagging local real estate market.

If hostilities in the Middle East can be avoided, Tuccillo projects the national housing market will pick up in the late spring, with the national economy following suit a few months later. A brief Middle East war that does not do permanent damage to oil distribution channels will delay the recovery by three months, "War pushes things back," Tuccillo said.

The local Realtors used Tuccillo to spread the message that the Syracuse housing market is not as bad off as other Northeast markets, especially those in the Boston-Philadelphia corridor. " Syracuse is a market that has performed better than the rest of the Northeast," Tuccillo said.

Tuccillo attributed the better performance largely to the fact that the Syracuse market acts more like a medium-sized Midwestern city than a large metropolis. "There wasn't the rapid growth in the 1980s, so there is no hangover now," Tuccillo said.

Nevertheless, the market is queasy. Syracuse's home sales dropped 7 percent to 5,893 in 1990, down from 6,326. Meanwhile, price increases have slowed. In 1990, average prices rose only 3.2 percent to $95,430. In 1989, the increase was 7 percent and, in 1988, the increase was 10.5 percent.

John Osta, president of the local Realtors' group, said the campaign called "Yes You Can!" is intended to combat the impression that the local real estate market is stagnant.

"We in Central New York get painted by the broad brush nationally," Osta said. "The plan is to counter the mentality and image in the marketplace that things are real bad."


Wednesday, September 20, 2006

Any Predictions?

For those of you who would like to weigh in on the prospects for residential housing in the next 3, 6 and 12 months, enter a comment below…

Also, no matter whether you’re “bullish” or “bearish” on housing, specify how long you think this current slowdown will last.