Monday, June 23, 2008

More Pain, Less Gain: S&P/Case-Shiller Preview for April 2008

As I had highlighted in a prior post, because of their strong correlation, the home price indices provided daily by Radar Logic can be effectively used as a preview of the more popular monthly S&P/Case-Shiller home price indices.

The current Radar Logic data reported on residential real estate transactions (condos, multi and single family homes) that settled as late as April 21 appears to indicate that price declines accelerated in many of the worst hit markets while markets that typically experience a seasonal lift this time a year are either trending lower or appear muted.


Miami, San Francisco, and Los Angeles are clearly continuing their historic price slide as sales remain in decline and inventory mounts.


Denver and Chicago both appear to be following the typical seasonal pattern of increasing prices during the high transaction months of the spring and early summer but it is important to note that the muted pricing rebound is coming off the a far lower base value reached during the fall and winter resulting in an overall trend of declining prices.

Washington DC is an nearly perfect example of a market that has broken down under the strain of the housing bust showing price declines even well into the early spring where it’s strong seasonal pattern typically brings increasing prices.

Boston remains at a cross roads with the Radar Logic data indicating that an interim low point for prices has been reached during February and that March essentially stayed flat at a point in the year when it’s strong seasonal demand usually drives prices higher.

What’s next for Boston?

We won’t know for sure for another couple of months but given March’s weakness, it’s very possible that Boston will start to look more like Washington DC with price declines occurring even during the spring and summer months.

Crashachusetts Existing Home Sales and Prices: May 2008

Today, the Massachusetts Association of Realtors (MAR) released their Existing Home Sales Report for May again showing the truly dismal and deteriorating circumstances that have befallen the Bay State’s housing market.

Whether it was a slow depression brought on by a local economy that has been eroding slowly for over eight years, well over two years of steadily declining home sales and prices, the credit crunch, a looming recession, a palpable sense of inflation of necessities like food and fuel or just simply a change in attitudes toward the notion of a house as a vehicle for untold wealth creation, the regions housing markets have now crossed a dangerous tipping point.

It appears that we have actually now entered the “price freefall” phase of the housing decline where elevated inventory, declining sales, and negative sentiment all combine to result in plunging home prices which, quite possibly, may continue to decline substantially even through the rest of the spring and summer months which are typically strong periods in any selling season.

With the report the Massachusetts Realtor leader Susan Renfrew makes another attempt at a self interested spin by suggesting that the month-to-month increase to prices indicates that the regions housing markets are moving “in the right direction”.

“While the number of sales for both single-family homes and condos were down in May, these decreases continue to narrow since the start of the year, which is definitely a move in the right direction,”

MAR reports that in May, single family home sales slumped 10.1% as compared to May 2007 with a 5% decline in inventory translating to a stark 10 months of supply and a median selling price decline of 9.2% while condo sales plunged 24.5% with a 9.0% decline in inventory translating to a lofty 9.5 months of supply and a median selling price decline of 2.6%.


Tomorrow, Standard & Poor’s will release their April installment of their S&P/Case-Shiller home price indices for Boston possibly showing the first month-to-month price decline since 1995, a very bad sign of things to come.

Check back as I will post the results when they become available.

As in months past, be on the lookout for the inflation adjusted charts produced by BostonBubble.com for an even more accurate "real" view of the current home price movement.

May’s Key MAR Statistics:

  • Single family sales declined 10.1% as compared to May 2007
  • Single family median price decreased 9.2% as compared to May 2007
  • Condo sales declined 24.5% as compared to May 2007
  • Condo median price decline of 2.6% as compared to May 2007
  • The number of months supply of single family homes stands at 10 months.
  • The number of months supply of condos stands at 9.5 months.
  • The average “days on market” for single family homes stands at 143 days.
  • The average “days on market” for condos stands at 135 days.

Friday, June 20, 2008

Collapsedachusetts Existing Home Sales Preview: May 2008

Sources inside the Massachusetts Association of Realtors (MAR) report that next week’s monthly existing home sales results will show that in May single family home sales dropped 10.1% on a year-over-year basis while condo sales collapsed a stunning 24.5% over the same period.

Further, the single family median home value declined a whopping 9.2% on a year-over-year basis to $322,500 while condo median prices declined 2.6% to $282,500.

It’s also important to note that the May single family home sales count was the lowest May count on record since 1992 and at 3491 units sold was 24.43% below the record May peak set in May 2004.

The following charts (click for larger) show the decline in single family home sales since 2005.

Notice that May 2008 is registering a home sales count well below even the 2007 level as well as indicating that the June’s results will likely be well below 5000 units, a significant decline.


After over two years of declining home sales, weakening home prices and now looming recession it appears that Massachusetts has just entered the price “free-fall” phase of the housing decline where home prices continuously drop even through the spring months which are typically strong in the region.

Stay tuned as next week the S&P/Case-Shiller home price index results will be available for Boston likely showing a continued decline even during the typically strong spring selling season.

The Almost Daily 2¢ - Turn Em’ In NOW!

By now everyone should be well aware of the fact that the FBI is putting some serious teeth behind their national campaign to investigate corruption and fraud in the financial, mortgage and real estate industries.

In just a little over three months "Operation Malicious Mortgage Fraud”, implemented by FBI officials of 46 of the 56 regional field offices, has netted over 400 of the worst offenders ranging from Bear Sterns hedge fund managers to “run of the mill” real estate agents and mortgage brokers.

Better yet, there have already been 173 convictions!

Given the effectiveness of this campaign, I think now would be just about the right time to turn in any and all information you may have on mortgage and real estate fraud.

If you feel that you or a member of your family, friends or other associates have been financially injured by some dealing with the mortgage and real estate industry, I strongly URGE you to follow the links below and report all you know as well as pass this post or the information contained in this post to those that you feel may have been defrauded.

The FBI provides an online facility for reporting “Tips and Public Leads” as well as hosts call lines at each of the regional field offices where you can speak at length with an investigator.

As a victim of identity theft some years back, I can assure you that the FBI investigators of your regional field office will be both welcoming and responsive.

The window is now wide open for you to easily report your case of mortgage or real estate fraud so don’t let this opportunity pass.

Now is the time to make the brazen and fraudulent profiteers of these corrupt industries and era pay for all of their wrongdoings.

Click here for the Online “Tips and Public Leads” form.

Click here to find the contact information of your regional FBI field office.

Thursday, June 19, 2008

Philadelphia Feeling: Federal Reserve Bank of Philadelphia Business Outlook Survey June 2008

Today, the Federal Reserve Bank of Philadelphia released the results of their Business Outlook Survey for June showing continued weakness to the regions manufacturing sector with the current activity index indicating contraction at –17.1, the seventh consecutive negative monthly result.

The survey of the Philadelphia regions manufacturing sector has been a pretty solid leading indicator of the overall strength or weakness and recession experienced by general economy.

As you can see by the following chart (click for larger version), during the past three post-recession expansion periods, the “current” diffusion index (more on diffusion indices later) generally vacillated between 0 and 35 while the “future” index left the period of contraction at an elevated level and eventually joining the “current” index.

Finally, as the economy pushes closer to contraction, both indices decline dramatically with a breach of -20 by the “current” index generally indicating that recession is upon us.


As you can see from recent results, -20 has been breached by the “current” index which now stands at -17.1 while the “future” index stands at 21.3.

Clearly, there is trouble afoot but components of the latest results also display a potential dangerous parallel to the stagflationary eras of the 70s and early 80s.

The following chart shows the latest results of the “current new orders” “current prices paid” and “future employment” components (click for larger versions).

Notice that while current orders and future employment declined, current prices paid have increased indicating a potential return to a stagflationary environment that hasn’t been seen since the early 80s.

It’s important to note that these three indicators have moved, more or less, together since the expansion of 1983 and have especially moved together during the recessionary periods of 1990 and 2001.

Now though, it appears that we may be seeing a divergence with an increase in prices paid and simultaneous decrease in growth.

The following chart (click for larger) shows these measures during the last stagflationary era seen between 1976 – 1980. Notice the clear divergence of rising prices and falling growth.

Follow The Leader: Index of Leading Economic Indicators May 2008

Today’s results of the Conference Board’s Leading Economic Indicators continues to indicate troubled times ahead increasing 0.1% from April but declining 1.83% compared to May 2007, leaving the index at 102.1.

It’s important to note that a year-over-year decline greater than 1.5% has ONLY preceded EVERY recession that has occurred in the last 59 years so the six significant consecutive year-over-year declines strongly suggests that overall the components of the index are indicating that recession is either here or very near.

Note that with today’s release The Conference Board has incorporated its annual benchmark revision to the complete series.

Mid-Cycle Meltdown?: Jobless Claims June 19 2008

Today, the Department of Labor released their latest read of Joblessness showing seasonally adjusted “initial” unemployment claims declined 5,000 to 381,000 from last week’s revised 386,000 claims while “continued” claims declined 76,000 resulting in an “insured” unemployment rate of 2.3%.

It’s very important to understand that today’s report continues to reflect employment weakness that is strongly consistent with past recessionary episodes and that unequivocal clarity will more than likely come in the next few releases.

Historically, unemployment claims both “initial” and “continued” (ongoing claims) are a good leading indicator of the unemployment rate and inevitably the overall state of the economy.

The following chart (click for larger version) shows “initial” and “continued” claims, averaged monthly, overlaid with U.S. recessions since 1967 and from 2000.

As you can see, acceleration to claims generally precedes recessions.


Also, acceleration and deceleration of unemployment claims has generally preceded comparable movements to the unemployment rate by 3 – 8 months (click for larger version).


In the above charts you can see, especially for the last three post-recession periods, that there has generally been a steep decline in unemployment claims and the unemployment rate followed by a “flattening” period of employment and subsequently followed by even further declines to unemployment as growth accelerated.

This flattening period demarks the “mid-cycle slowdown” where for various reasons growth has generally slowed but then resumed with even stronger growth.

So, looking at the post-“dot com” recession period we can see the telltale signs of a potential “mid-cycle” slowdown and if we were to simply reflect on the history of employment as an indicator of the health and potential outlook for the wider economy, it would not be irrational to conclude that times may be brighter in the very near future.

But, adding a little more data I think shows that we may in fact be experiencing a period of economic growth unlike the past several post-recession periods.

Look at the following chart (click for larger version) showing “initial” and “continued” unemployment claims, the ratio of non-farm payrolls to non-institutional population and single family building permits since 1967.

One notable feature of the post-“dot com” recession era that is, unlike other recent post-recession eras, job growth has been very weak, not succeeding to reach trend growth as had minimally accomplished in the past.

Another feature is that housing was apparently buffeted by the response to the last recession, preventing it from fully correcting thus postponing the full and far more severe downturn to today.

I think there is enough evidence to suggest that our potential “mid-cycle” slowdown, having been traded for a less severe downturn in the aftermath of the “dot-com” recession, may now be turning into a mid-cycle meltdown.

Wednesday, June 18, 2008

Reading Rates: MBA Application Survey – June 18 2008

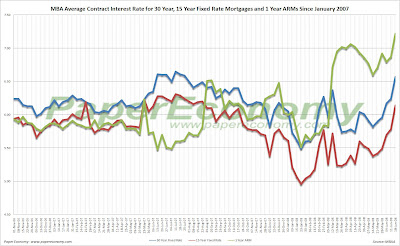
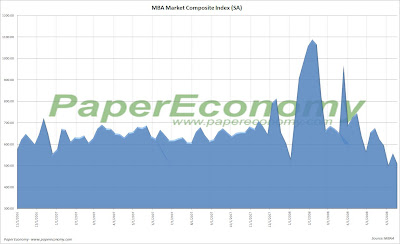
The Mortgage Bankers Association (MBA) publishes the results of a weekly applications survey that covers roughly 50 percent of all residential mortgage originations and tracks the average interest rate for 30 year and 15 year fixed rate mortgages, 1 year ARMs as well as application volume for both purchase and refinance applications.

The purchase application index has been highlighted as a particularly important data series as it very broadly captures the demand side of residential real estate for both new and existing home purchases.

The latest data is showing that the average rate for a 30 year fixed rate mortgage surged 33 basis points since last week to 6.57% while the purchase application volume declined by 4.3% and the refinance application volume slumped 15% compared to last week’s results.

It’s important to note that the average interest rate on an 80% LTV 30 year fixed rate loan has jumped dramatically now resting at the top of the range seen throughout 2007 while the interest rate for an 80% LTV 1 year ARM remains significantly elevated now resting 65 basis points ABOVE the rate of an average 80% LTV 30 year fixed rate loan despite all the herculean efforts by the Federal Reserve to bring rates down.

Also note that all application volume values reflect only “initial” applications NOT approved applications… i.e. originations… actual originations would likely be notably lower than the applications.

The following chart shows how the principle and interest cost and estimated annual income required to cover the PITI (using the 29% “rule of thumb”) on a $400,000 loan has changed since November 2006.

The following chart shows the average interest rate for 30 year and 15 year fixed rate mortgages over the last number of weeks (click for larger version).


The following charts show the Purchase Index, Refinance Index and Market Composite Index since November 2006 (click for larger versions).


Tuesday, June 17, 2008

Production Pullback: Industrial Production May 2008

Today, the Federal Reserve released their monthly read of industrial production showing continued declines across many industries, particularly for those related to consumer spending, construction and business vehicles, resulting in a decline of 0.2% to total aggregate production since last month and a .06% decline on a year-over-year basis.

“Final product” consumer durable goods continue to show accelerating weakness falling 8.47% as an aggregate on a year-over-year basis, with particularly significant declines coming specifically from home appliances, furniture and carpeting which declined for the twenty first consecutive month by 11.71% on a year-over-year basis.

Construction supply production has been showing the most severe contraction to wood products seen in at least the last 20 years.

Although automotive production has been showing weakness since the middle of 2004, business vehicle production is now showing a stark contraction.

The following charts (click for larger) show the overall consumer durable component along with the Home Appliances, Furniture and Carpeting sub-component on both a time series and year-over-year basis, construction supply production with the wood products sub-component, and general and business related vehicle production all overlaid with the last two recessions for comparisons purposes.


New Residential Construction Report: May 2008

Today’s New Residential Construction Report continues to firmly demonstrate the intensity and completeness of the washout conditions that now exist in the nation’s housing markets particularly for new residential construction showing tremendous declines on both a peak and year-over-year basis to single family permits both nationally and across every region.

Single family housing permits, the most leading of indicators, again suggests extensive weakness in future construction activity dropping 41.4% nationally as compared to May 2007.

Moreover, every region showed significant double digit declines to permits with the West declining 47.1%, the Midwest declining 37.1%, the South declining 41.3%, and the Northeast declining 33.3%.

Keep in mind that these declines are coming on the back of last year’s record declines.

To illustrate the extent to which permits and starts have declined, I have created the following charts (click for larger versions) that show the percentage changes of the current values on a year-over-year basis as well as compared to the peak year of 2004.

Declines to single family permits have contracted measurably in terms of monthly YOY declines, and the fact that we are now seeing declines of roughly 30%-50% on the back of 2006 and 2007 declines should provide a an unequivocal indication that the housing markets are by no means stabilizing.


Here are the statistics outlined in today’s report:

Housing Permits

Nationally

  • Single family housing permits down 41.4% as compared to May 2007.
Regionally

  • For the Northeast, single family housing down 33.3% as compared to May 2007.
  • For the Midwest, single family housing permits down 37.1% as compared to May 2007.
  • For the South, single family housing permits down 41.3% compared to May 2007.
  • For the West, single family housing permits down 47.1% as compared to May 2007.
Housing Starts

Nationally

  • Single family housing starts down 32.1% as compared to May 2007.
Regionally

  • For the Northeast, single family housing starts down 38.3% as compared to May 2007.
  • For the Midwest, single family housing starts down 42.8% as compared to May 2007.
  • For the South, single family housing starts down 37.7% as compared to May 2007.
  • For the West, single family housing starts down 48.7% as compared to May 2007.
Housing Completions

Nationally

  • Single family housing completions down 33.0% as compared to May 2007.
Regionally

  • For the Northeast, single family housing completions down 17.9% as compared to May 2007.
  • For the Midwest, single family housing completions down 23.4% as compared to May 2007.
  • For the South, single family housing completions down 35.0% as compared to May 2007.
  • For the West, single family housing completions down 39.8% as compared to May 2007.
Keep in mind that this particular report does NOT factor in the cancellations that have been widely reported to be occurring in new construction.

Monday, June 16, 2008

The Almost Daily 2¢ - Crunching The Numbers, Realtor Style!

I know this item has already made the rounds over the weekend but I wanted to take a moment to highlight again the great work done by the excellent blogger of the New Jersey Real Estate Report in uncovering the National Association of Realtors (NAR) gross mishandling of basic homes sales data for New Jersey.

Just to reiterate, although the first quarter 2008 home sales data released by the NAR last month showed widespread and significant home sales declines for 47 states, it also included what was termed by various media organizations as a potential “silver lining” with the New Jersey results unexpectedly showing a 4.05% increase in sales on a year-over-year basis, a significant turnaround.

Many onlookers were puzzled but the New Jersey Real Estate Report’s blogger James Bednar, intimately familiar with the regions housing market, immediately suspected there was an error.

After multiple emails to the NAR regional and national leadership concerning the matter, the NAR quietly and only locally reported that there was, in fact, a dramatic error made while “crunching the numbers”.

As it turns out, there was no increase at all and New Jersey home sales, in reality, actually declined by a whopping 30%.

How’s that for a blunder?

Sadly though, a “number crunching” error of this scale coming from the National Association of Realtors really doesn’t seem very surprising.

This event confirms that the NARs numbers should always be taken with a significant degree of suspicion and that their data should not be assumed to be immune from careless or even negligent mishandling.

Homebuilder Blues: NAHB/Wells Fargo Home Builder Ratings June 2008

Today, the National Association of Home Builders (NAHB) released their Housing Market Index (HMI) for June showing continued evidence that the new home market is experiencing a prolonged bout of depression.

The release came along with a bleak outlook and a continued plea for a government bailout of the housing debacle from Chief Economist David Seiders.

“Clearly, conditions in the housing market remain very weak, and our builder members are not seeing any signs of improvement, … Indeed, the continuing erosion of employment and consumer confidence/sentiment, coupled with surging energy costs, falling house prices and rising home mortgage foreclosures, pose considerable downside risks to the economy and our housing forecast. A targeted stimulus such as a temporary home-buyer tax credit would help turn this situation around and restore housing as an engine of economic growth.”

Each component of the NAHB housing market index is now sitting at or near the worst levels ever seen in the over 20 years the data has been being compiled strongly suggesting that the current severe contraction has surpassed all other events seen in the last 22 years and is now firmly in uncharted territory.