Showing posts with label yun. Show all posts

Tuesday, January 08, 2008

Pending Home Sales: November 2007

Today, the National Association of Realtors (NAR) released their Pending Home Sales Report for November 2007 showing a truly stark and even worsening continuation of the historic decline to residential housing on a year-over-year basis, both nationally and in every region.

Continuing down the second slope of the pullback in demand for residential housing, ALL regions are now tracking at or below the lowest values ever recorded with the Northeast now registering nearly 30% fewer sales than in 2001, the first year Pending Home Sales were tracked.

As usual, NAR Senior Economist Laurence Yun makes another attempt at self interested spin and false optimism suggesting that today there are more potential home buyers but that many are simply sitting on the sidelines waiting to pounce on the market in the coming spring market.

“There are more people with financial capacity now than in 2005, but many are trying to market-time their purchase. As a result, the exact timing and the strength of a home sales recovery is a bit uncertain. A meaningful recovery in existing-home sales could occur as early as this spring, or it may be further delayed toward late 2008.”

Too bad Yun forgets to mention that the potential borrowing power of all buyers has declined significantly as the ongoing unwinding of the mortgage-credit bubble has resulted in significantly tighter lending standards and the outright absence of Jumbo loans.

The following chart shows the national Pending Homes Sales Index since 2005 compared monthly. Notice that each year, the months value is decreasing consistently (click for larger version).
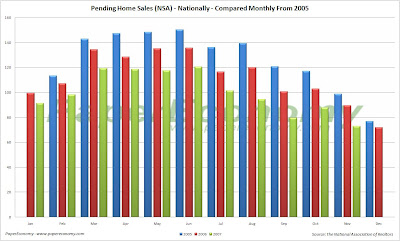
The following chart shows the year-over-year changes to the national Pending Home Sales index as well as comparing the latest results against the values seen in the peak year of 2005 (click for larger version).

Note that in the above charts, I had to use the Not Seasonally Adjusted (NSA) data series as NAR changed the methodology for their Seasonally Adjusted (SA) series a while back and never republished the numbers. This is why none of the data appears to be breaking below a value of 100 because it’s the SA series that is now below 100.

Keep in mind the current pending sales decline comes ON TOP of last years historic fall-off so the continued weakness is a sure sign that the decline is not ephemeral.

Look at the November seasonally adjusted pending home sales results and draw your own conclusion:

  • Nationally the index was down 19.2% as compared to November 2006.
  • The Northeast region was down 19.1% as compared to November 2006.
  • The West region was down 18.5% as compared to November 2006.
  • The Midwest region was down 18.6% as compared to November 2006.
  • The South region was down 19.8% as compared to November 2006.
So it appears that, year-over-year, contract activity is still dropping rather sharply with ALL regions continuing to show significant declines.

NARcasting The Future: January 2008

Today, the National Association of Realtors (NAR) provided (oops from last month… the latest 2007 estimate is not quite their final yet…) their latest estimate of annual existing home sales for 2007 revising down their prior estimate marginally to 5.66 million housing units sold along with providing both their current estimate for 2008 as well as, of course, another dose of truly ridiculous spin.

In an effort to put their absurd bias into perspective I compiled all their existing home sales forecasts for 2007 and now 2008 into a chart along with a list of prominent quotes supplied with each forecast.


12/11/2006 Prediction: 6.40 million units.
Lereah "Most of the correction in home prices is behind us."

1/10/2007 Prediction: 6.42 million units.
Lereah "The good news is that the steady improvement in sales will support price appreciation moving forward."

2/7/2007 Prediction: 6.44 million units.
Lereah "After reaching what appears to be the bottom in the fourth quarter of 2006, we expect existing-home sales to gradually rise all this year and well into 2008."

3/13/2007 Prediction: 6.42 million units.
Lereah "Although existing-home sales will be marginally reduced due to subprime lending restrictions, they should be gradually rising this year and next."

4/11/2007 Prediction: 6.34 million units.
Lereah "Tighter lending standards will dampen home sales a bit, but by less than a couple of percentage points from initial projections."

4/30/2007
Lereah Leaves NAR for Move.com

5/9/2007 Prediction: 6.29 million units.
Yun "Housing activity this year will be somewhat lower than in earlier forecasts."

6/6/2007 Prediction: 6.18 million units.
Yun "Home sales will probably fluctuate in a narrow range in the short run, but gradually trend upward with improving activity by the end of the year."

7/11/2007 Prediction: 6.11 million units.
Yun "Home prices are expected to recover in 2008 with existing-home sales picking up late this year."

8/8/2007 Prediction: 6.04 million units.
Yun “With the population growing, the demand for homes isn’t going away – it’s just being delayed.”

9/11/2007 Prediction: 5.92 million units.
Yun “Patient buyers in most areas who do their homework will recognize that housing remains a good long-term investment.”

10/10/2007 Prediction: 5.78 million units.
Yun "The speculative excesses have been removed from the market and home sales are returning to fundamentally healthy levels, while prices remain near record highs, reflecting favorable mortgage rates and positive job gains."

11/13/2007 Prediction: 5.5 million units.
Yun "In some ways, the extended real estate boom from 2001 to 2005 created unrealistic expectations that housing is a short-term high-yield investment… 2007 will be the fifth best year for housing on record"

12/10/2007 Prediction: 5.67 million units in 2007, 5.7 million units in 2008.
Yun "The broad trend over the coming year will be a gradual rise in existing-home sales, but because sales are exceptionally low in the final months of 2007, total sales for 2008 will be only modestly higher than 2007."

01/08/2008 Prediction: 5.66 million units in 2007, 5.7 million units in 2008.
Yun "A meaningful recovery in existing-home sales could occur as early as this spring, or it may be further delayed toward late 2008."

Monday, January 07, 2008

BNN MUST SEE TV! – Pizza Inflates, Roubini Squared, Shiller Unwinds, Spectacular Davidowitz, Gloomy Wien, and Yun Spins Again!

Here is a series of great and revealing video segments from the last couple of weeks that may not lift your spirits, but should provide some relevant outlook for the consumer and the looming (or current) recession.

First, here is a somewhat startling segment with the David Brandon, CEO of Domino’s Pizza in which he states that the consumer is clearly pulling back and that “unprecedented” food inflation poses the biggest issue for their operations.

Brandon states that the cost of just about every component of their product is at a 10 year high and that it has been hard to raise prices as fast as the underlying commodities have increased.

Needless to say, if the U.S. consumer is pulling back on pizza … draw your own conclusion.

Watch the Brandon’s Wakeup Call on BNN!

Next, Professor Nouriel Roubini and Brian Wesbury join Larry Kudlow to debate the fate of the supposed “Goldilocks” economy.

Roubini accurately points out that “real” consumption has been weak, residential investment has been collapsing and the current liquidity crisis presents the worst financial crisis in 20 years.

Wesbury amazingly puts aside housing rattles off a bunch of anecdotes about getting parking and a seat at a restaurant and then suggests that there is “no evidence that this economy is slowing down”.

Watch Roubini Spar A Foolish Wesbury on BNN!

Next, Again Professor Nouriel Roubini and Charles Lieberman of Advisors Capital Management face off on the fate of the economy and the ramifications of the mortgage-credit debacle and rising energy costs.

Roubini continues to provide his consistently accurate point of view that inevitably sees the economy coming in for a “hard landing” recession while Lieberman suggests that the impact from higher energy costs is “negligible”, the negative savings rate is merely a statistical phenomena, and the adverse effects of the mortgage-credit debacle are “much much smaller” than Roubini realizes… my money is on Roubini.

Watch Roubini Spar a Delusional Charles Lieberman on BNN!

Next, Professor Robert Shiller joins Bloomberg to discuss the most recent results of the S&P/Case-Shiller home price indices.

Shiller suggests that the boom is clearly unraveling with broad based price declines and the seizing up of the credit markets and suggest that it is “it’s not implausible that prices wont bottom out for another five years”.

Watch Shiller Watch The Unwinding on BNN!

Next up, a SPECTACULAR segment… Howard Davidowitz of Davidowitz & Associates joins Bloomberg to discuss the outlook for the retailers and the economy in general.

This segment is a MUST SEE… Davidowitz does the best job I have seen to date of putting the retail and consumer pictures into context.

Watch Davidowitz Talk Reality on BNN!

Next, Byron Wien, Chief Investment Strategist with Pequot Capital joins Bloomberg to discuss his sobering outlook on the economy for 2008.

It seems the consensus tide is now firmly turning in, like it or not, in favor of some significantly slower times ahead.

Wien believes that the housing collapse has been underestimated and its drag on the economy will remain substantial.

Watch A Truly Gloomy Outlook on BNN!

Finally, Lawrence Yun, chief economist with the National Association of Realtors joins Bloomberg to spin a tale of housing market stabilization.

Yun partially sidesteps the question on the potential for price declines for 2008 stating that he sees no declines nationally and even price increases in regions in the middle of the country.

Watch Yun Spin Spin Spin!!! On BNN!

Wednesday, October 10, 2007

NARcasting The Future: October 2007


Today, the National Association of Realtors (NAR) released yet another downward revision to their outlook for existing home sales for 2007 along with another dose of truly ridiculous spin.

In an effort to put their absurd bias into perspective I compiled all their forecasts for 2007 home sales into a chart along with a list of prominent quotes supplied with each forecast.


12/11/2006 Prediction: 6.40 million units.
Lereah "Most of the correction in home prices is behind us."

1/10/2007 Prediction: 6.42 million units.
Lereah "The good news is that the steady improvement in sales will support price appreciation moving forward."

2/7/2007 Prediction: 6.44 million units.
Lereah "After reaching what appears to be the bottom in the fourth quarter of 2006, we expect existing-home sales to gradually rise all this year and well into 2008."

3/13/2007 Prediction: 6.42 million units.
Lereah "Although existing-home sales will be marginally reduced due to subprime lending restrictions, they should be gradually rising this year and next."

4/11/2007 Prediction: 6.34 million units.
Lereah "Tighter lending standards will dampen home sales a bit, but by less than a couple of percentage points from initial projections."

4/30/2007
Lereah Leaves NAR for Move.com

5/9/2007 Prediction: 6.29 million units.
Yun "Housing activity this year will be somewhat lower than in earlier forecasts."

6/6/2007 Prediction: 6.18 million units.
Yun "Home sales will probably fluctuate in a narrow range in the short run, but gradually trend upward with improving activity by the end of the year."

7/11/2007 Prediction: 6.11 million units.
Yun "Home prices are expected to recover in 2008 with existing-home sales picking up late this year."

8/8/2007 Prediction: 6.04 million units.
Yun “With the population growing, the demand for homes isn’t going away – it’s just being delayed.”

9/11/2007 Prediction: 5.92 million units.
Yun “Patient buyers in most areas who do their homework will recognize that housing remains a good long-term investment.”

10/10/2007 Prediction: 5.78 million units.
Yun "The speculative excesses have been removed from the market and home sales are returning to fundamentally healthy levels, while prices remain near record highs, reflecting favorable mortgage rates and positive job gains."

Tuesday, October 02, 2007

Pending Home Sales: August 2007


Today, the National Association of Realtors (NAR) released their Pending Home Sales Report for August 2007 showing yet again a truly stark and horrendous continuation of the historic decline to residential housing on a month-to-month and year-over-year basis, both nationally and in every region.

We are now firmly heading down the second slope of the pullback in residential housing demand with the Northeast, Midwest, West and the National regions having now fallen as much as 20% BELOW the seasonally adjusted home sales activity recorded in 2001, the first year Pending Home Sales were tracked.

As usual, NAR Senior Economist Laurence Yun takes another crack at false optimism again suggesting that the circumstances for Jumbo loans will return to “normal” thus restoring sales activity later in the fall.

“Fewer contracts were being written because of mortgage availability issues, and a separate internal survey of our members shows more than 10 percent of sales contracts fell through at the last moment in August, primarily the result of canceled loan commitments, … The volume of activity we’re seeing today is below sustainable market fundamentals because some creditworthy people are trying to buy homes but can’t because of the credit crunch.

“The impact was greater in high-cost markets that are more dependent on jumbo mortgages. In some areas, as much as 30 percent of signed contracts were falling through in August when the credit crunch problem peaked, … The problem has since become less severe, though jumbo loan rates are still higher than they would be under normal conditions. Therefore, sales activity in late fall will better reflect market fundamentals.”

The following chart shows the national Pending Homes Sales Index since 2005 compared monthly. Notice that each year, the months value is decreasing consistently (click for larger version).

The following chart shows the year-over-year changes to the national Pending Home Sales index as well as comparing the latest results against the values seen in the peak year of 2005 (click for larger version).

Note that in the above charts, I had to use the Not Seasonally Adjusted (NSA) data series as NAR changed the methodology for their Seasonally Adjusted (SA) series a while back and never republished the numbers. This is why none of the data appears to be breaking below a value of 100 because it’s the SA series that is now below 100.

Keep in mind the current pending sales decline comes ON TOP of last years historic fall-off so the continued weakness is a sure sign that the decline is not ephemeral.

Look at the August seasonally adjusted pending home sales results and draw your own conclusion:

  • Nationally the index was down 21.5% as compared to August 2006.
  • The Northeast region was down 18.3% as compared to August 2006.
  • The West region was down 27.1% as compared to August 2006.
  • The Midwest region was down 18.0% as compared to August 2006.
  • The South region was down 21.3% as compared to August 2006.
So it appears that, year-over-year, contract activity is still dropping rather sharply with ALL regions continuing to show significant declines.