 Today, the National Association of Realtors (NAR) released their Existing Home Sales Report for May further confirming, perfectly clearly, the tremendous weakness in the demand of existing residential real estate with both single family homes and condos declining uniformly across the nation’s housing markets while inventory and supply remained elevated.
Although this continued falloff in demand is mostly as a result of the momentous and ongoing structural changes taking place in the credit-mortgage markets, consumer sentiment surveys are continuing to indicate that consumers are materially feeling the current stagflationary trends which will likely result in even further significant sales declines to come.
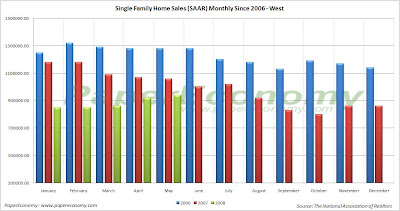
Furthermore, we are continuing to see SOLID declines to the median sales price for both single family homes and condos across virtually every region with the most notable occurring in the West showing a decline of 16.8% to the median single family home sales price and a decline of 11.8% to the median condo price.
As usual, the NAR leadership continues spinning the results all the while turning to Washington DC for additional handouts.
NAR senior economist Lawrence Yun suggests that although the market is “fragile” a home buyer tax credit and permanently higher GSE loan limits will get the “housing engine humming”.
“Keep in mind that the volume of home sales is the primary driver of economic activity that is tied to housing, … It’d be premature to say the improvement marks a turnaround. The market is fragile, so a first-time home buyer tax credit and a permanent raise in loan limits would be important steps to get the housing engine humming.”
Meanwhile, NAR president Dick Gaylord continues to spin his yarn that a home is a vehicle for wealth creation:
“Home buyers are starting to get off the fence and into the market, drawn by drops in home prices in many areas and armed with greater access to affordable mortgages, … Today’s buyer plans to stay in a home for 10 years, which is a good strategy for building long-term wealth.”
Too bad for the Realtors though since lending standards will only get more restrictive as lenders further realize losses from subprime, alt-a, prime Jumbo and even prime conforming loans.
The era of FICO driven “slam-dunk” lending is coming to a close and with it will inevitably go all the absurdities leaving borrowers and the real estate industry, if they are lucky, to simply operate in an environment of the traditional “rule of thumb” requirements of substantial down-payments and sensible earnings to debt ratios.
The latest report provides, yet again, truly stark and total confirmation that the nation’s housing markets are declining dramatically with EVERY region showing significant double digit declines to sales of BOTH single family and condos as well as increases to inventory and an unusually elevated monthly supply resulting of the collapsing pace of sales.
Keep in mind that these declines are coming “on the back” of TWO SOLID YEARS of dramatic declines further indicating that the housing markets are truly in the process of a tremendous correction.
The following (click for larger versions) are charts showing sales for single family homes, plotted monthly, for 2006, 2007 and 2008 as well as national existing home inventory and month supply.


Below is a chart consolidating all the year-over-year changes reported by NAR in their most recent report.


