 Today, the National Association of Home Builders (NAHB) released their Housing Market Index (HMI) showing additional evidence that the new home market is experiencing a new leg down in declines.
Measuring builder confidence across six key data points, the builder survey has been a bellwether for the new home market since 1985.
The component measures used to formulate the overall HMI are respondent ratings on “present conditions”, “future conditions” and “buyer traffic” all of which continue to indicating significant current and future weakness as the new home market slumps its way slowly forward, now long separated from an exceptionally disappointing spring selling season.
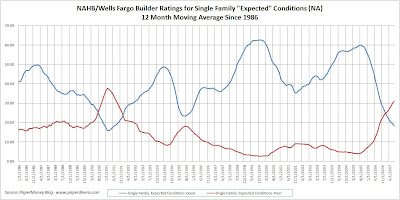
In fact, July’s “present”, “future” and “buyer traffic” condition results have moved to the worst levels seen since early 1991 when the nation’s housing market was slumping through its last major housing bust.
The following charts show “present conditions”, “future conditions” and “buyer traffic” both smoothed since 1986 and unadjusted since 2005 (click for larger versions).
Keep in mind that for each measure respondents are asked to assign both a “good” and “poor” rating so in each chart you will notice “good” slumping while “poor” is surging.


