 May’s results capped another month of indisputable evidence that the housing decline did not bottom in the fall of 2006, as many optimists had hoped but, in fact, continues to collapse under the weight of slumping sales, surging foreclosures and inventories, the mortgage meltdown and increasing interest rates.
The final Q1 2007 GDP Report confirms that the historic decline to residential fixed investment continues weigh heavily the US economy with GDP registering a mere 0.7%, the weakest results since the end of 2002.
The following chart shows real residential and non-residential fixed investment versus overall GDP since Q1 2003 (click for larger version).
 The housing weakness also appears to clearly show up in retail sales as consumers pullback on spending for some of the most discretionary of goods.
 The Census Department’s New Residential Construction Report which continues to indicate significant weakness in the nation’s housing markets and for residential construction showing large declines on a year-over-year basis to single family permits, starts, and completions nationally and across every region.
Homebuilder confidence dropped to an 15 year low with respondents indicating that estimates of “present” and “future” conditions as well as buyer traffic continues to reach new lows.
The Census Department’s New Residential Home Sales Report that, showed renewed declines and a 5.10% downward revision to last month’s unexpected “surge”.
As with prior months, on a year-over-year basis sales are still declining in the double digits at 15.8% below the sales activity seen in May 2006.
NAR’s Existing Home Sales Report indicates worsening and uniform weakness to the nation’s housing markets with virtually all regions showing considerable declines to median price AND sales as well as significant increases to inventory and monthly supply.
Home sales were, in fact, down in EVERY region with the majority of declines in the double digits.
The April 2007 results of the S&P/Case-Shiller Indices are continued to show weakness for the nation’s housing markets with 14 of the 20 metro areas tracked reporting significant declines.
Topping the list of decliners on a year-over-year basis was Detroit at -9.35%, San Diego at -6.70%, Washington DC at -5.70%, Tampa at -4.97 and Boston at -4.52%.
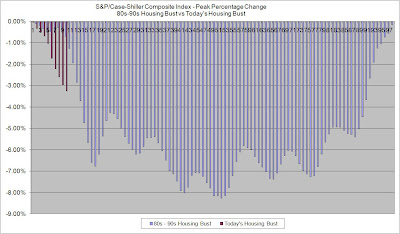
Furthermore, comparing the last major downturn in the late 80s and early 90s to the current data may indicate that the current housing downturn is in its infancy with year-over-year declines only just having materialized in the last four months.
 Furthermore, the Census Department’s Construction Spending Report for May again demonstrated the significant extent to which private residential construction spending is contracting.
It’s important to note that with May’s results the Census Department revised its numbers going all the way back to 1993 resulting in a substantially more sharp drop-off during the latest decline than had been originally reported as well as shifting the peak in spending from December 2005 to February 2006.
To see the difference, simply compare the charts included with last month’s Constructing Capitulation post.
With the weakening trend continuing, total residential construction spending fell -17.56% as compared to May 2006 while private single family construction spending declined by a grotesque -26.47%.
Key Report Details:
- The seasonally adjusted annul rate of private residential construction spending has now dropped 21.12% from the peak set back in February 2006.
- Overall private residential construction spending dropped -17.56% as compared to May 2006.
- Single Family residential construction spending dropped 26.47% as compared to May 2006.


