 Today’s New Residential Construction Report continues to indicate significant weakness in the nations housing markets and for residential construction showing substantial declines on a year-over-year basis to single family permits both nationally and across every region.
Single family housing permits, the reports most leading of indicators, again suggests extensive weakness in future construction activity dropping 27.5% nationally as compared to June 2006.
Moreover, every region showed high double digit declines to permits with the West declining 30.7%, the South declining 30.3%, the Midwest declining 18.1% and the Northeast declining 14.9%.
Keep in mind that these declines are coming on the back of last year’s record declines.
To illustrate the extent to which permits and starts have declined, I have created the following charts (click for larger versions) that show the percentage changes of the current values compared to the peak years of 2004 and 2005.
Notice that on each chart the line is essentially combining the year-over-year changes seen in 2005 and 2006 and shows virtually every measure trending down precipitously.
Although year-over-year declines to permits, for example, have not accelerated measurably from September 2006, the fact that they continue to decline roughly 30% should provide a solid indication that they are by no means stabilizing.


 Remember that permits, starts, and competitions are not simply independent measures but are, in fact, three logically related and dependent measures.
In the process of a building project, first you get the “permit”, next you “start” building, and finally you “complete” the project.
For this reason, one must adjust expectations prior to reading a newly released Census Department report to account for the true nature of the data published simultaneously each month.
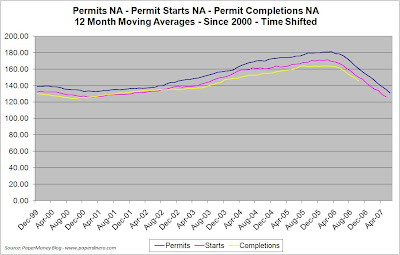
As in past months, I have “smoothed” out the unadjusted data and aligned the three data series (i.e. moved starts ahead a month and completions ahead six months) to make more obvious their trend.
The following is the unadjusted permits, permit-starts and permit-completion data charted since 2000 (click for larger version).
 The following is the unadjusted permits, permit-starts and permit-completion data smoothed with a 12 month moving average (click for larger version).
 The following is the smoothed data aligned to indicate the dependent nature of each series and showing the obvious leading nature of permits (click for larger version).
 The following is the aligned data normalized to make the relationship even more obvious.
Here are the statistics outlined in today’s report:
Housing Permits
Nationally
- Single family housing permits down 4.1% from May, down 27.5% as compared to June 2006
- For the Northeast, single family housing down 1.1% from May, down 14.9% as compared to June 2006.
- For the West, single family housing permits down 1.9% from May, down 30.7% as compared to June 2006.
- For the Midwest, single family housing permits down 3.4% from May, down 18.1% as compared to June 2006.
- For the South, single family housing permits down 5.9% from May, down 30.3% compared to June 2006.
Nationally
- Single family housing starts down 0.2% from May, down 21.6% as compared to June 2006.
- For the Northeast, single family housing starts up 0.9% from May, up 19.6% as compared to June 2006.
- For the West, single family housing starts up 6.7% from May, down 20.3% as compared to June 2006.
- For the Midwest, single family housing starts up 3.1% from May, down 21.7% as compared to June 2006.
- For the South, single family housing starts down 4.6% from May, down 27.2% as compared to June 2006.
Nationally
- Single family housing completions down 6.3% from May, down 29.8% as compared to June 2006.
- For the Northeast, single family housing completions up 11.4% from May, down 16.4% as compared to June 2006.
- For the West, single family housing completions down 12.0% from May, down 38.3% as compared to June 2006.
- For the Midwest, single family housing completions up 0.5% from May, down 35.6% as compared to June 2006.
- For the South, single family housing completions down 8.4% from May, down 25.3% as compared to June 2006.