Wednesday, September 20, 2006

Congressional Bubble Trouble Take 2!

This week, the Senate Banking Committee held a hearing entitled “Calculated Risk: Assessing Non-Traditional Mortgage Products” as a follow up to last weeks meeting on the housing bubble.

Similar to last weeks meeting, this meeting was NOT broadcast live by C-Span (or the Banking Committee website for that matter) but was taped and slotted to be aired at a later time.

UPDATE:

C-Span eventually aired the meeting in its entirety this morning (Friday morning) and I was able to “rip” the entire broadcast.


Stream with Windows Media Player (High Quality)


Stream with Windows Media Player (Low Quality)

Also, If you prefer to simply listen to the audio, a link to the complete audio of the meeting was posted at CalculatedRisk.


Tuesday, September 19, 2006

Foolish PaperMoney!

I hate to toot my own horn but here it goes… toot!

It seems that the recent PaperMoney post chronicling the National Association of Realtors President Thomas Stevens’ real estate woes piqued the interest of one of the “fools” over at the Motley Fool.

The following is a link to the article posted today by Seth Jayson that includes a nice little cite to PaperMoney...Thanks Seth!!:

Read... When Bubbles Attack!

Pirate’s Perspective


We have all seen the numbers. All followed the daily stream of housing related reports and commentary. Many have even experienced first hand the effects of the ever declining housing market.

But has one of us… Just one ever wondered what a pirate might say in this situation.

I give you the pirate’s perspective (from CraigsList’s EastBayNotRay):

YE be hornswaggled of your doubloons soon enough Yarg!

Ye home market be scuttled says aye.

Ye blackspotted sprogs be left with nary a piece of eight.

Ye be needin ta' splice the mainbrace, as ye flounder marooned in ye poorhouse. Yarrr!

Ye ousing Head's be manning ye bilge pumps day an night, but ye soon be walking the plank and dancing with Jack Ketch!

Ye scallywags be three sheets to the wind, but ye soon find yerselves in Davey Jones' Locker! Arrgh!

I cant disagree with that… or at least I wouldn’t dare as he may nail my entrails to the mainsail…

Today’s New Construction Report

Obviously demonstrating the persistence of the dramatic downtrend in the US housing market, today’s “New Residential Construction Report” provides additional evidence that residential real estate is experiencing a protracted decline.

Popularly reported as showing a 6% decline in housing starts from last months revised figure, the report, if viewed more thoroughly, displays many, far more significant declines.

Particularly interesting is that this months report show that virtually every indicator is now recording double digit year over year declines, with the South and Midwest regions now on par with the more depressed figures of the Northeast and West regions.

Here are the statistics outlined in today’s report:

Housing Permits

Nationally

  1. Single family housing permits down 3.5% from July, down 25.0% as compared to August 2005

Regionally

  1. For the Northeast, single family housing permits down 1% from July, down 27.4% as compared to August 2005.
  2. For the West, single family housing permits down 2.3% from July, down 31.2% as compared to August 2005.
  3. For the Midwest, single family housing permits down 8.2% from July, down 28.5% as compared to August 2005.
  4. For the South, single family housing permits down 2.9% from July, down 20.3% compared to August 2005.

Housing Starts

Nationally

  1. Single family housing starts down 5.9% from July, down 20.6% as compared to August 2005.

Regionally

  1. For the Northeast, single family housing starts down 7.9% from July, down 19.3% as compared to August 2005.
  2. For the West, single family housing starts down 4.4% from July, down 33.4% as compared to August 2005.
  3. For the Midwest, single family housing starts down 12.9% from July, down 28.7% as compared to August 2005.
  4. For the South, single family housing starts down 6.1% from July, down 9.9% as compared to August 2005.

Keep in mind that this particular report does NOT factor in the cancellations that have been widely reported to be occurring in new construction.

As further reports are released, cancellations should show an even greater effect on permitting, starts and completions.

Defining “Soft Landing”

“a moderate slowing of economic growth to a rate of about 2% to 3%, which is expected to keep inflation from accelerating.” - www.tdwaterhouse.ca

“The avoidance of both inflation and high interest rates as well as a recession as an economy slows its growth rate”- www.investorwords.com

“When the economy is growing at strong rate, the Fed will try to engineer a soft landing by raising interest rates enough to slow the economy down without putting it into recession.”www.investopedia.com

The term “Soft Landing”, used by economists and media alike, is today generally understood as describing the process by which the Federal Reserve attempts to use its various powers to prevent or soften recession.

But, given its current, almost ubiquitous use, it’s hard not to wonder how long this term has been applied to economic tinkering and under what circumstances have “Soft Landings” actually been achieved?

It’s widely accepted that Former Federal Reserve Board Chairman Alan Greenspan coaxed the economy into a “Soft Landing” after the bust of the “Dot-Com” bubble. But how was that “success” for economic engineering actually gauged?

NASDAQ is still priced over 50% below its peek set almost seven years ago and there seems to be ample evidence to suggest that, by dramatically slashing interest rates in the wake of the dot-com collapse, the Federal Reserve dampened the effects of the oncoming recession but dramatically fueled the even larger and more pervasive housing bubble we are now vexed with today.

So, it seems that it may be very hard to determine accurately the success of such economic engineering. At the very least, it can be conceded that for an endeavor that’s typically scrutinized and measured through a mind-boggling number of factors (i.e. month to month changes in inflation, retail sales, consumer confidence, money supply, trade deficit, etc.), the relatively rough concept of a “Soft Landing” leaves much to be desired.

A thorough investigation of a range of national newspaper archives results in some interesting findings.

Not surprisingly, for the majority of the 20th century, the term “Soft Landing” was used to describe the events surrounding airplane arrivals or spacecraft touchdowns.

There is virtually no economic reference to “Soft Landing” prior to the late summer and fall of 1973 when, during the Nixon administration, officials were preparing to steer the then booming economy down from it’s heights in the face of widespread rising prices.

The Goal of the Nixon Administration after the "tough Phase IV" economic program is a "phase out" of all controls, according to the director of the U.S. Office of Management and Budget.

". . . So we have geared out actions (in Phase IV) to pilot the economy into a soft landing at a sustainable level of output — about 4%, "We see no reason why a much-needed slowdown has to turn into an unwanted recession. Already, there are indications that the economy has slowed down in the second quarter (of this years)," Ash said.

The Van Nuys News – August 5, 1973

In a separate speech, Treasury Secretary George P. Shultz said the wholesale price index for all goods will make an astounding jump in August, but inflation should gradually decrease "once the bulge is behind us. Addressing a meeting of the American Bankers Association in Washington, Shultz said there was a "good possibility" that the economy would make a "reasonably soft landing at a rate of four per cent real growth." The figure for the fourth quarter of 1972 and the first quarter of 1973 was twice that.

United Press International – August 25, 1973

He dismissed what he called the "gloomy scare talk about a "recession" being on the horizon. "President Nixon has set his sights on a soft landing, not a hard one," Ford said, "as the economy moves into a period of stained economic growth with reasonable price stability."

The Charleston Gazette – October 20, 1973

Although, the term “Soft Landing” seems to have been well established in economic circles, it appears that popular use of the phrase may have originated with the recessionary and inflation-wrought era of the 1970s.

As for the success of this attempt at moderating the economy and preventing recession, certainly many may differ on the details of this sordid era, but clearly depressing influences were not moderate by any definition.


Saturday, September 16, 2006

Realtors Follies

CNBC aired a brief interview with the National Association of Realtors President, Thomas M. Stevens on Wednesday morning in which it was revealed that Stevens has had his home on the market for roughly a year.

Aside from appearing uncomfortable, Stevens seemed slightly at a loss for words, attempting to explain his own personal experience of the housing slowdown with some frail reasoning concerning his traveling and being unable to follow the good advice of his Realtor.

It seems that, with this questioning, CNBC was only following up on an article that ran in the Washington Post the prior Saturday entitled “A Humbling Lesson for Realtors' President” which recounted essentially the same details.

In that article, Stevens seems to express the sentiment of a novice seller rather than an industry veteran when recounting his experience.

"Who knew last September how long this down trend was going to continue," Going on Stevens states "You need to adjust the price. . . . But I didn't do that. And my house is still on the market."

"What I should have done, was listened to my agent and cut the price by $50,000 to $100,000 early on, and the property would have sold last October."

Better yet "I should have listed it a month earlier,"

The house, located at 10897 Woodleaf Lane, in Great Falls, Virginia, was constructed by the Stevens’ in 1980 and was their first house after they married.

The ZipRealty.com listing [UPDATE: Looks like the ZipRealty Listing has now been removed!... Heres the link at Realtor.com instead] sheet shows that this 4 bedroom, 3.5 bath brick colonial with “exceptional room sizes” and “easy commuting” has, in fact, been on the market for over 350 days with an unchanged listing price of $1,450,000.

Additionally, the Zillow.com estimate on the house ranges from $1,371,963 - $1,608,000 while 5 suggested comparables, all having sold within the last 11 months, ranged between $1,175,000 and $1,300,000 yielding an average selling price of $1,280,000.

Furthermore, in an ironic twist, it seems that Stevens home is facing some pricing competition from a truly gargantuan McMansion two doors down at 10890 Woodleaf Lane.

That house, a 7900 square foot “goliath” colonial which boasts a marble foyer, granite kitchen, whirlpool tub and even an indoor tire swing, has been listed for 193 days being reduced from its original list price of $1,950,000 to its current price of $1,775,000.

That’s a relatively slim 18% difference in list price for a home that is 18 years newer, has an additional bath and nearly twice the internal area. In addition, the McMansion owner has been recently reducing the list price by increments of $100,000 so it seems that a showdown may be immanent.

Yet, Stevens is most likely not overly concerned about this sale as he and his wife Lindy have been preoccupied the past few years remodeling their new, and truly spectacular home located in Vienna, Virginia.

Their new home, officially know as “The Windover House”, was purchased “off market” (i.e. inside sale with no marketing) in 2001 by the Stevens who beat out four other prospective buyers eventually paying $1,300,000 for the 4400 square foot antique farmhouse known locally as “Big Yellow”.

Apparently, a significant factor in Stevens winning the bidding process was that he agreed to not split up the 1.7 acre lot that the home stands on into parcels to sell individually thus maintaining the integrity of the “Windover Heights Historic District”.

Interestingly, the Windover Heights Historic District has become a hotbed of controversy lately with significant disagreement between various owners and townspeople over the role of historic preservation.

There are various meeting minutes, articles and even a blog and youtube.com clips chronicling the feisty events of the historic town planning commission.

It seems that, with their extravagant renovations of “Big Yellow”, Tom and Lindy Stevens have thrust themselves into the melee, having their home cited on many occasions as an example of inconsistent application of commission rules.

The following is an excerpt from the commissions meeting minutes of 05/07/2003:

Mrs. Stich wanted to know why certain people are allowed to build extra garages or porches to their homes, noting that when plans were submitted to the WHBR in 1979 for a three (3) car garage to the house she presently lives in, they were denied.

Mrs. Stich said in her four (4) years living in the district, she has noticed the inconsistencies and hypocrisies in the WHBR.

Mrs. Stich stated that the historic district has nothing to do with “citizenry or caring about the small Town feel effect”, because if it did the people who are fighting to keep the district would be fighting for preservation and mentioned Mr. Henon who lived at 130 Pleasant Street, NW, who had to see the big addition going up at 316 Windover Avenue, NW and didn’t blame him for selling his house.

Mrs. Stich stated the WHHD is full of inconsistencies.

So there it is, Housing slowdown, old home not selling, pricing pressure from outlandish McMansion, multi-year renovation of new home, angry new neighbors… Given the circumstances, it’s hard to not have some sympathy.

Wednesday, September 13, 2006

Congressional Bubble Trouble Take 1!

So, it seems it was next to impossible to get live coverage of today’s Senate Banking Committee meeting on the housing bubble.

Despite numerous calls and emails to C-Span, both Senator Richard Shelby (R-AL) and Senator Paul Sarbanes (D-MD) Communications Directors, and even staff members of the Dirksen Senate Office building itself, the committee hearing could not be broadcast live.

Apparently, since this was technically a sub-committee meeting, the Senate would not broadcast it on their website as they would normally do for a general committee meeting.

As for C-Span, they had already fixed their schedule for Wednesday morning and was not planning on covering the event but they did indicate to me this morning that they would be taping it and airing it later in the day (a possible tip of the hat to all of you that stopped to email or call them yesterday…).

Well, they eventually aired the meeting tonight and for those of you who were not fortunate enough to catch it, I ripped the entire broadcast and posted it at my website.

You can watch it anytime you want by clicking the following link:


Downlaod and Play with RealPlayer


Stream with Windows Media Player (High Quality)


Stream with Windows Media Player (Low Quality)

You’ll need to have the RealPlayer installed in order to view it.

Ill try to convert it to a Microsoft video format tomorrow for those of you who prefer the Windows Media Player.

Also, it appears that the entire transcript for this meeting was posted earlier this afternoon by both CalculatedRisk and BubbleMeter.

On a funny note, during NAR President Stevens opening comments, he apologized that NAR Chief Economist David Lereah could not be present but offered the Senators a hard copy of the now infamous “Reality Check” PowerPoint presentation.

That seemed to me to be an almost comical attempt to enter NAR’s “official” position into the Congressional record.

Also, there were several questions related to the OFHEO’s home price index as the Chief Economist of that office, Patrick Lawler, was one of the guest speakers.

Remember, ALL 462 statistical regions of the OFHEO home price index are hosted right here at PaperMoney so feel free to browse them anytime.

Again, thanks to all of you who took time to either call or email C-Span. Ill also be posting next weeks meeting (the final in the two part series) on the topic of exotic mortgages.


Tuesday, September 12, 2006

Now Is The Time!

Tomorrow, (at 10am) in an open session of the Senate Banking Committee entitled “The Housing Bubble and its Implications for the Economy”, United States Senators will question some of the real estate and housing industries leading economists and spokespersons.

[UPDATE: CalculatedRisk posts additional details from the Banking Comittee website.]

This session will be followed up by another session next week dedicated to the topic of the growing use of innovative mortgages and their implications.

I have just called C-Span to request that this hearing be broadcast. Currently, it’s not certain that this hearing will be covered in tomorrow’s lineup.

I STRONGLY encourage anyone to either call or send an email to C-Span requesting that they cover these hearings.

C-Span by Phone: Dial (202)-737-3220 and tell the operator that you want to request programming of a congressional hearing. He will put you through to a menu that leads to the program director that covers congress.

C-Span by Email: events@c-span.org

Sunday, September 10, 2006

Chart the Bubble

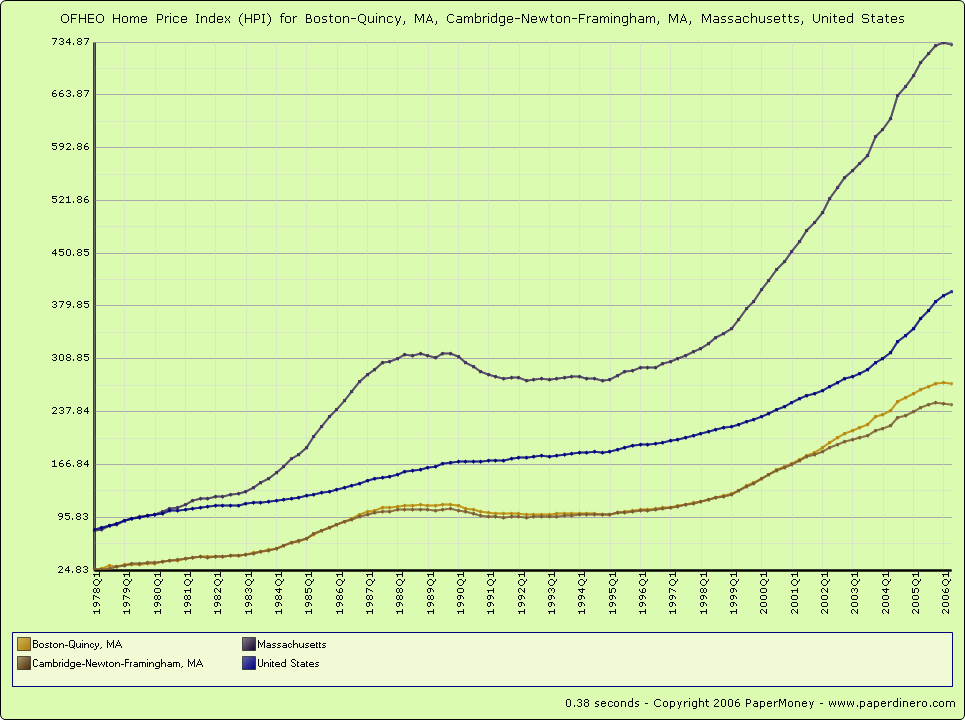
They say a “picture is worth a thousand words”. Well, I wonder what they would say about a dynamic picture that lets you compare the home prices (as an index) of over 450 different U.S. regions.

Why not Judge for yourself? Take a look at my new Home Price Index tool.

The data driving the tool comes directly from the Office of Federal Housing Enterprise Oversight (OFHEO) and is derived from mortgage information supplied by Freddie Mac and Fannie Mae. Read the official report for more technical description of how the index values are computed.

Better yet, the tool allows you to mix and compare any number of statistical regions on the same chart as well as selecting the specific range of years to include (from 1975 to the present quarter).

There is an index series for the nation as a whole as well as for each of the 50 states and the District of Columbia. Additionally, there are 9 Census regions and over 350 metropolitan regions as well.

Also, in the browser, the charts are just simple images so feel free to save them to your machine and pass them around!

Again, if you notice any issues or simply have comments, please email me.

Friday, September 08, 2006

Wiki Wiki Housing Bubble

For those of you out there who have yet to read (or haven’t read lately) the Wikipedia page dedicated to the United States Housing Bubble, I would strongly recommend that you do so.

To say that the page is thorough would be an understatement.

It has been meticulously edited and formatted with many of the most compelling and pertinent data including housing cost and P/E analysis, charts, and discussion on the media and overall cultural factors that influenced the housing mania along with an abundance of exacting footnotes.

It is truly a living document dedicated to what may, in the end, be one of the most compelling stories of our time.

Thanks Frothy (and to the others) who have done such a superb job authoring this great Wiki page over the last nine months.

Thursday, September 07, 2006

Cashing Out!

It appears that an individual investor is dumping his portfolio of multi-family properties in Arlington Massachusetts.

The assortment includes numerous styles, periods, and locations and currently totals $8,359,000 in combined listings.

A quick perusal of listing with ZipRealty.com results in a startling 11 out of 32 multi-family listings being handled by Center Realty & Management, Inc. of Winchester MA, an agency with no official presence whatsoever on the web.

Furthermore, all listing descriptions are nearly identical, reading as follows:

“Motivated seller!! Says bring offers! Fantastic location, nice wood floors make this home a great purchase. Strong rental history. Come see.”

This is not the first investor seen cashing out in the Boston area recently but the fact that this individual is listing fully one third of all multi-family homes in Arlington, simultaneously, seems to speak volumes.

Wednesday, September 06, 2006

Mass Run-Up!

To say Massachusetts has experienced a housing boom over the last ten years would be an understatement.

Anecdotally, anyone living in Massachusetts during the run up, particularly the greater Boston metropolitan area could not have been unaware that something significant was occurring.

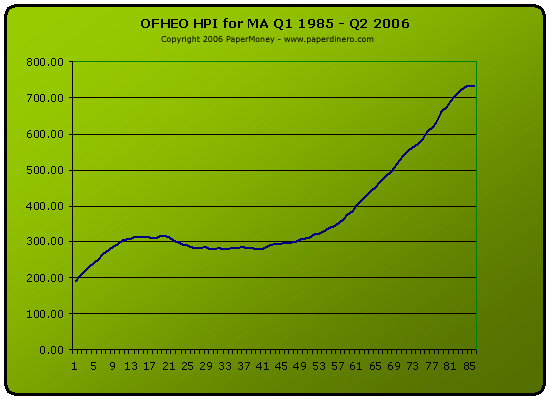
But having the actual home price data plotted out makes for a truly dramatic sight.

The above chart (click it for a closer look), plotting the house price index for Massachusetts over the last 86 quarters (Q1 1985 to Q2 2006, 21 years and 2 quarters), was produced from data published in by the Office of Federal Housing Enterprise Oversight (OFHEO).

Since the current cycle began in Q4 1994, home prices across Massachusetts have increased over 260%.

Prior to the expansion phase ending in Q2 2006, home prices in Massachusetts had increased for an astounding 45 consecutive quarters… that’s officially over 11 years of solid price growth!

Some key points from the graph:

  1. 5 Year Decline During Last Cycle - Prior to the latest run up, Massachusetts experienced a (mild by comparison) significant expansion that peaked during Q4 1989. After the peak, the area went into a decline that lasted for approximately 20 quarter before bottoming out during Q4 1994. This decline represented an 11 quarter or almost a 3 year retracement in prices.
  2. 8 Years To Recover From Last Cycle – From the 1989 peak it took 8 full years (32 quarters) for prices to recover.
  3. Prices Now In Decline – Prices have been relatively flat since Q4 2005 and have now actually declined roughly 1% since Q1 2006.

Tuesday, September 05, 2006

National Home Prices Cooling “Significantly” with Massachusetts Leading the Decline

Today, the Office of Federal Housing Enterprise Oversight (OFHEO) released its second quarter home price report and its findings were unequivocal.

The nation is now experiencing the sharpest decline of home price appreciation since the OFHEO’s started tracking house prices in 1975.

Most interestingly, the report shows that the regions of the U.S. that had just experienced the greatest gains in the last HPI report are now experiencing the greatest decline in home price appreciation.

In addition, the official HPI index factors in changes to home values from both home sales and home refinancing. The decline in appreciation was shown to be even more significant when only home sales were considered.

Particularly notable is Massachusetts, where actual home prices have dropped .44% in the second quarter of 2006. Furthermore, of all 50 states and the District of Columbia, Massachusetts showed the third lowest year over year (YOY) appreciation of 3.4%.

Regionally, East North Central (Wisconsin, Michigan, etc), West North Central (The Dakotas to Kansas and Missouri), and New England had the lowest percent change to home prices for both the second quarter of 2006 and year over year.

Out of a possible 275 metropolitan regions, 10 of Michigan’s rank within the 20 lowest for year over year appreciation.

Additionally, the Boston-Quincy metro area ranks 236 with a one year change in appreciation of 2.92%.

Bad Sign

In a recent and perplexing turn of events, many communities across America seem to have spontaneously taken to debating and passing or modifying sign ordinances.

Whether it’s in response to the political signs sure to flood yards across the country ahead of this falls elections or just a sudden coincidental movement against public advertising, the regulations are having an effect on the activities of the real estate community.

In many areas, real estate agents, already facing the challenges of a slowing housing market, find themselves pitted against local officials bent on enforcing sign restrictions.

Offending signs have been confiscated and destroyed at the expense of local real estate agents who may face additional fines if they do not eventually comply.

The following are some recently reported restrictions and incidents:

  1. Moon Township, PA – Real estate signs advertising an “open house” are limited to one sign at the entrance of a subdivision for directional purposes. Recently, signs have been confiscated by local officials while real estate agents meet to discuss the “confusing” restrictions.
  2. Baker County, FL – Has strict regulations against yard sale, car wash and real estate signs. City code officers remove all signs found in violation.
  3. Reidsville, NC – City officials have recently begun cracking down on signs violating local rules. Local real estate agents attempting to better comply with the regulations, team up to cut down on the number of signs.
  4. Bradenton, Sarasota, FL – Commissioners recently voted to adopt restrictive sign regulations. Local real estate agent speaks out against the rules stating that they will “…restricting us on open house signs and limiting us with directionals.. You're taking away a Realtor's tools”.
  5. Cape Girardeau City, MO – In April council members adopted restrictive rules placing restrictions on real estate and other types of signs. Soon, city officials will vote to exempt regulations specifically for real estate signs.
  6. Fort Mitchell, KY – Existing regulations that limit all types of signs will be relaxed. Recent action is primarily related political signs and the upcoming elections.
  7. Nassau County, FL – Officials have begun cracking down on signs found violating new restrictions. 299 real estate signs were confiscated in a recent “Clean Sweep” pass by officials.

Saturday, September 02, 2006

The State of the Cape

Having just spent a week on Cape Cod, it seemed fairly apparent that the reports of the housing busts effects on the vacation spot were not exaggerated.

It had been noted earlier this summer that home sales on Cape Cod were off some 20.1% year to date and a whopping 30.7% in July as compared to July of 2005.

Additionally, inventories have been steadily rising and currently stand at over a 10 month supply with homes spending an average of 120 “days on market”.

The result is that sellers, although still holding firm to their prices, are facing an increasingly deteriorating market that’s getting worse by the day.

It had been reported recently that prices in the Cape Cod rental market, even the seasonal rental market, have been coming down as home sellers resort to renting to bide their time.

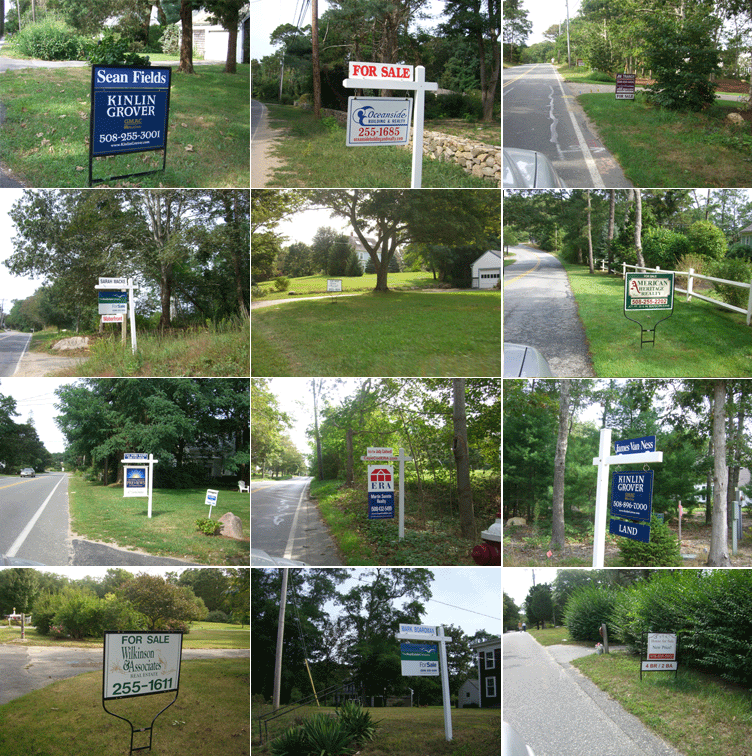
By the way, the collage of home sale lawn signs above were taken while driving a short stretch of Orleans. Left out of the picture were the equally numerous new construction “contractor” signs which in many cases were the builders attempt to sell direct to the buyer.