Showing posts with label homebuilders. Show all posts

Wednesday, April 15, 2009

Homebuilder Blues: NAHB/Wells Fargo Home Builder Ratings April 2009

Today, the National Association of Home Builders (NAHB) released their latest Housing Market Index (HMI) showing an increase to the overall index as well as all component indices.

It’s important to recognize that although the series are seasonally adjusted, each series has generally shown notable strength or noticeable flattening during the first quarter of each of the last 4 years.

The new home market will likely not resume any significant form of healthy function until the considerable overhang of inventory is cleared.

Each component of the NAHB housing market index remains WELL BELOW the worst levels ever seen in the over 20 years and continues to remain firmly in uncharted territory.


Monday, March 16, 2009

Homebuilder Blues: NAHB/Wells Fargo Home Builder Ratings March 2009

Today, the National Association of Home Builders (NAHB) released their latest Housing Market Index (HMI) showing dramatic new lows and continued evidence that the new home market is experiencing a prolonged bout of depression.

Each component of the NAHB housing market index remain WELL BELOW the worst levels ever seen in the over 20 years the data has been being compiled strongly suggesting that the current severe contraction has surpassed all other events seen in the last 22 years and is now firmly in uncharted territory.


Wednesday, January 21, 2009

Homebuilder Blues: NAHB/Wells Fargo Home Builder Ratings January 2009

Today, the National Association of Home Builders (NAHB) released their latest Housing Market Index (HMI) showing dramatic new lows and continued evidence that the new home market is experiencing a prolonged bout of depression.

Each component of the NAHB housing market index remain WELL BELOW the worst levels ever seen in the over 20 years the data has been being compiled strongly suggesting that the current severe contraction has surpassed all other events seen in the last 22 years and is now firmly in uncharted territory.


Tuesday, September 16, 2008

Homebuilder Blues: NAHB/Wells Fargo Home Builder Ratings September 2008

National Association of Home Builders (NAHB) released their latest Housing Market Index (HMI) showing continued evidence that the new home market is experiencing a prolonged bout of depression.

Each component of the NAHB housing market index remain WELL BELOW the worst levels ever seen in the over 20 years the data has been being compiled strongly suggesting that the current severe contraction has surpassed all other events seen in the last 22 years and is now firmly in uncharted territory.


Wednesday, February 20, 2008

New Residential Construction Report: January 2008

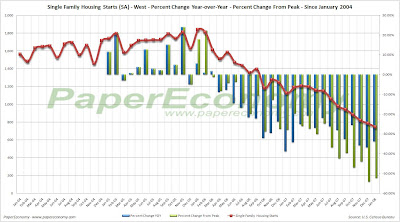
Today’s New Residential Construction Report continues to firmly demonstrate the intensity of the total washout conditions that now exist in the nation’s housing markets and for new residential construction showing tremendous declines on a year-over-year basis to single family permits both nationally and across every region.

Single family housing permits, the most leading of indicators, again suggests extensive weakness in future construction activity dropping 40.3% nationally as compared to January 2007.

Moreover, every region showed significant double digit declines to permits with the West declining 53.8%, the South declining 37.5%, the Midwest declining 34.3% and the Northeast declining 29.7%.

Keep in mind that these declines are coming on the back of last year’s record declines.

To illustrate the extent to which permits and starts have declined, I have created the following charts (click for larger versions) that show the percentage changes of the current values on a year-over-year basis as well as compared to the peak year of 2004.

Declines to single family permits have NOW ACCELERATED measurably in terms of monthly YOY declines, and the fact that we are now seeing declines of roughly 30%-50% on the back of 2006 declines should provide a an unequivocal indication that the housing markets are by no means stabilizing.


Here are the statistics outlined in today’s report:

Housing Permits

Nationally

  • Single family housing permits down 40.3% as compared to January 2007.
Regionally

  • For the Northeast, single family housing down 29.7% as compared to January 2007.
  • For the Midwest, single family housing permits down 34.4% as compared to January 2007.
  • For the South, single family housing permits down 37.5% compared to January 2007.
  • For the West, single family housing permits down 53.8% as compared to January 2007.
Housing Starts

Nationally

  • Single family housing starts down 33.8% as compared to January 2007.
Regionally

  • For the Northeast, single family housing starts down 16.7% as compared to January 2007.
  • For the Midwest, single family housing starts down 31.1% as compared to January 2007.
  • For the South, single family housing starts down 32.3% as compared to January 2007.
  • For the West, single family housing starts down 49.1% as compared to January 2007.
Housing Completions

Nationally

  • Single family housing completions down 32.6% as compared to January 2007.
Regionally

  • For the Northeast, single family housing completions down 51.1% as compared to January 2007.
  • For the Midwest, single family housing completions down 22.8% as compared to January 2007.
  • For the South, single family housing completions down 35.6% as compared to January 2007.
  • For the West, single family housing completions down 24.1% as compared to January 2007.
Keep in mind that this particular report does NOT factor in the cancellations that have been widely reported to be occurring in new construction.

Thursday, November 01, 2007

Constructing Capitulation: September 2007

Looking back at September’s results (released throughout October) it’s now unequivocally obvious that the nation’s housing markets, having fully transcended the mania that existed primarily in the first half of the decade and now, in its aftermath, after being dramatically and irreparably impaired by the unwinding of the resultant mortgage-credit debacle, are now hurtling headlong into a dramatic new leg down.

While housing demand continues to slow and inventories swell far beyond historic levels, the credit markets that had provided such a plentiful supply of cheap Jumbo mortgages remains non-existent.

Homebuilders have now clearly accepted the severity of the recession and are re-pricing accordingly but as is typical, the existing home sellers remain behind the curve.

Pending home sales, the most leading existing home sales indicator, again showed a truly dramatic continuation of the decline to residential housing sales both nationally and in every region.

The Northeast, Midwest, West and the National regions having now fallen as much as 20% BELOW the seasonally adjusted home sales activity recorded in 2001, the first year Pending Home Sales were tracked.

The National Association of Realtors (NAR) released their eighth consecutive downward revision to their annual home sales forecast for 2007 putting the current outlook far below the “rose colored” initial predictions from the start of the year.

NAR Senior Economist Lawrence Yun is now attempting to persuade others that the speculative excesses have now cleared the market. “The speculative excesses have been removed from the market and home sales are returning to fundamentally healthy levels, while prices remain near record highs, reflecting favorable mortgage rates and positive job gains."

Countrywide Financial (NYSE:CFC) continues to register tremendous borrower stress as delinquencies and foreclosures continuing to remain at troubling levels with delinquencies jumping 30.44% and foreclosures soaring 149% since September of 2006.

The housing weakness still appears to be contributing to a pullback in the retail sales of the most discretionary goods although I will continue to revise the procedures for determining this correlation later this month.

Homebuilder confidence is now sitting AT OR BELOW the worst levels ever seen in the over 20 years the data has been being compiled.

This suggests that the current severe correction has surpassed all other events seen in the last 22 years and is now firmly in uncharted territory.

The Census Department’s New Residential Construction Report firmly indicates a new leg down in the decline for residential construction showing substantial declines on a year-over-year and month-to-month basis to single family permits both nationally and across every region.

The August 2007 results of the S&P/Case-Shiller home price indices continued to show significant weakness for the nation’s housing markets with 15 of the 20 metro areas tracked reporting year-over-year declines and now virtually ALL (except Charlotte NC which changed 0.0%) metro areas showing declines from their respective peaks.

Topping the list of peak decliners are Detroit at -12.18%, Tampa at -10.57%, San Diego at -9.43%, Miami as -9.11%, Washington DC at -8.38%, Phoenix at -8.16% and Las Vegas at -7.65%.


NAR’s Existing Home Sales Report showing perfectly clearly, that demand for residential real estate has now taken a new leg down uniformly across the nation’s housing markets likely as a direct result of the significant structural changes that have taken place in the credit-mortgage markets.

The advance GDP report for Q3 2007 showed an increase in the severity of the drag coming from the decline in residential fixed investment, that is, all investment made to construct or improve new and existing residential structures including multi–family units, with the current quarterly fall-off registering a whopping decline of 20.1% since last quarter while shaving 1.05% from overall GDP.

The following chart shows real residential and non-residential fixed investment versus overall GDP since Q1 2003 (click for larger version).

The Census Department’s New Residential Home Sales Report for September again confirmed the hideous falloff in demand for new residential homes both nationally and in every region as well as reporting significant downward revisions to June, July and Augusts’ results.

As with prior months, on a year-over-year basis sales are still declining significantly, with the national measure dropping a truly ugly 23.3% below the sales activity seen in September 2006.

The latest release of the Reuters/University of Michigan Survey of Consumers showed in unequivocal terms that the US consumer is feeling the burn from declining home values.

In fact, 28% of respondents reported that their own homes had declined in value, well above the record peak result of 24% recorded during the last housing slump in 1992.

Finally, the Census Department’s Construction Spending report for September again demonstrated the significant extent to which private residential construction spending is contracting.

With the weakening trend continuing, total residential construction spending fell -16.78% as compared to September 2006 while private single family construction spending declined by a grotesque -26.14%.

Key Report Details:

  • The seasonally adjusted annul rate of private residential construction spending has now dropped 26.53% from the peak set back in February 2006.
  • Overall private residential construction spending dropped -16.78% as compared to September 2006.
  • Single Family residential construction spending dropped 26.14% as compared to September 2006.
The following charts show changes to construction spending (click for larger version):


Wednesday, October 17, 2007

Homebuilder Blues: NAHB/Wells Fargo Home Builder Ratings October 2007

Yesterday, the National Association of Home Builders (NAHB) released their Housing Market Index (HMI) showing additional evidence that the new home market is experiencing a new leg down in declines.

The release came along with a renewed sense of reality and some guarded, yet optimistic, outlook from Chief Economist David Seiders who continues to see home sales recovering by the second quarter of 2008.

“Consumers are still trying to sort out market realities and get the best deals they can, … Many prospective buyers may very well have unrealistic expectations regarding new-home prices as well as how much they can expect to receive for their existing homes. When the market is in proper balance, people can recognize a good deal when it comes along; at this point, they view a good deal as a moving target. … Indeed, NAHB’s housing forecast indicates that home sales should stabilize within the next six months and show significant improvement during the second half of next year.”

It’s important to understand that each component of the NAHB housing market index is now sitting AT OR BELOW the worst levels ever seen in the over 20 years the data has been being compiled.

This suggests that the current severe correction has surpassed all other events seen in the last 22 years and is now firmly in uncharted territory.

Measuring builder confidence across six key data points, the builder survey has been a bellwether for the new home market since 1985.

The component measures used to formulate the overall HMI are respondent ratings on “present conditions”, “future conditions” and “buyer traffic” all of which continue to indicating significant current and future weakness as the new home market slumps its way slowly forward.

The following charts show “present conditions”, “future conditions” and “buyer traffic” both smoothed since 1986 and unadjusted since 2005 (click for larger versions).
Keep in mind that for each measure respondents are asked to assign both a “good” and “poor” rating so in each chart you will notice “good” slumping while “poor” is surging.


Tuesday, September 18, 2007

Homebuilder Blues: NAHB/Wells Fargo Home Builder Ratings September 2007

Today, the National Association of Home Builders (NAHB) released their Housing Market Index (HMI) showing additional evidence that the new home market is experiencing a new leg down in declines.

The release came along with a guarded yet optimistic perspective from Chief Economist David Seiders who now sees home sales recovering by the second quarter of 2008.

“Certainly problems across the mortgage finance arena are taking their toll on buyer demand, which is weighing heavily on builder confidence measures, … We now expect to see home sales return to an upward path by the second quarter of 2008 and we expect housing starts to begin a gradual recovery process by the third quarter of next year. At that point, the market will have substantial growth potential.”

Measuring builder confidence across six key data points, the builder survey has been a bellwether for the new home market since 1985.

The component measures used to formulate the overall HMI are respondent ratings on “present conditions”, “future conditions” and “buyer traffic” all of which continue to indicating significant current and future weakness as the new home market slumps its way slowly forward, now long separated from an exceptionally disappointing spring selling season.

In fact, July’s “present”, “future” and “buyer traffic” condition results have moved even nearer to the worst levels seen since early 1991 when the nation’s housing market was slumping through its last major housing bust.

The following charts show “present conditions”, “future conditions” and “buyer traffic” both smoothed since 1986 and unadjusted since 2005 (click for larger versions).

Keep in mind that for each measure respondents are asked to assign both a “good” and “poor” rating so in each chart you will notice “good” slumping while “poor” is surging.