Thursday, July 14, 2022

The Inflation Conflagration

Like this post? Consider subscribing to my Substack for additional insights and content today!

Once I lived the life of a millionaire 
Spending my money'n I did not care 
Carrying my friends out for a good time
Buyin’ bootleg liquor, champagne and wine

Lord but I got busted and I fell so low
Didn't have no money and nowhere to go
This is the truth, Lord, without a doubt
Nobody wants you when you're down and out

Lord, if I could get my hands on a dollar again
I would hold it till that eagle grins
I would try just for one little house
Nobody knows me when I'm down and out

- excerpt from Scrapper Blackwell’s “Nobody knows you when you are down and out”

The inflation that we are seeing today was not caused solely by recent exogenous shocks like China’s COVID lock-downs or the war in Ukraine or any other temporary event, but instead it has come as the result 15+ years of reckless monetary policy and 30+ years of moral hazard induced mal-investment. 

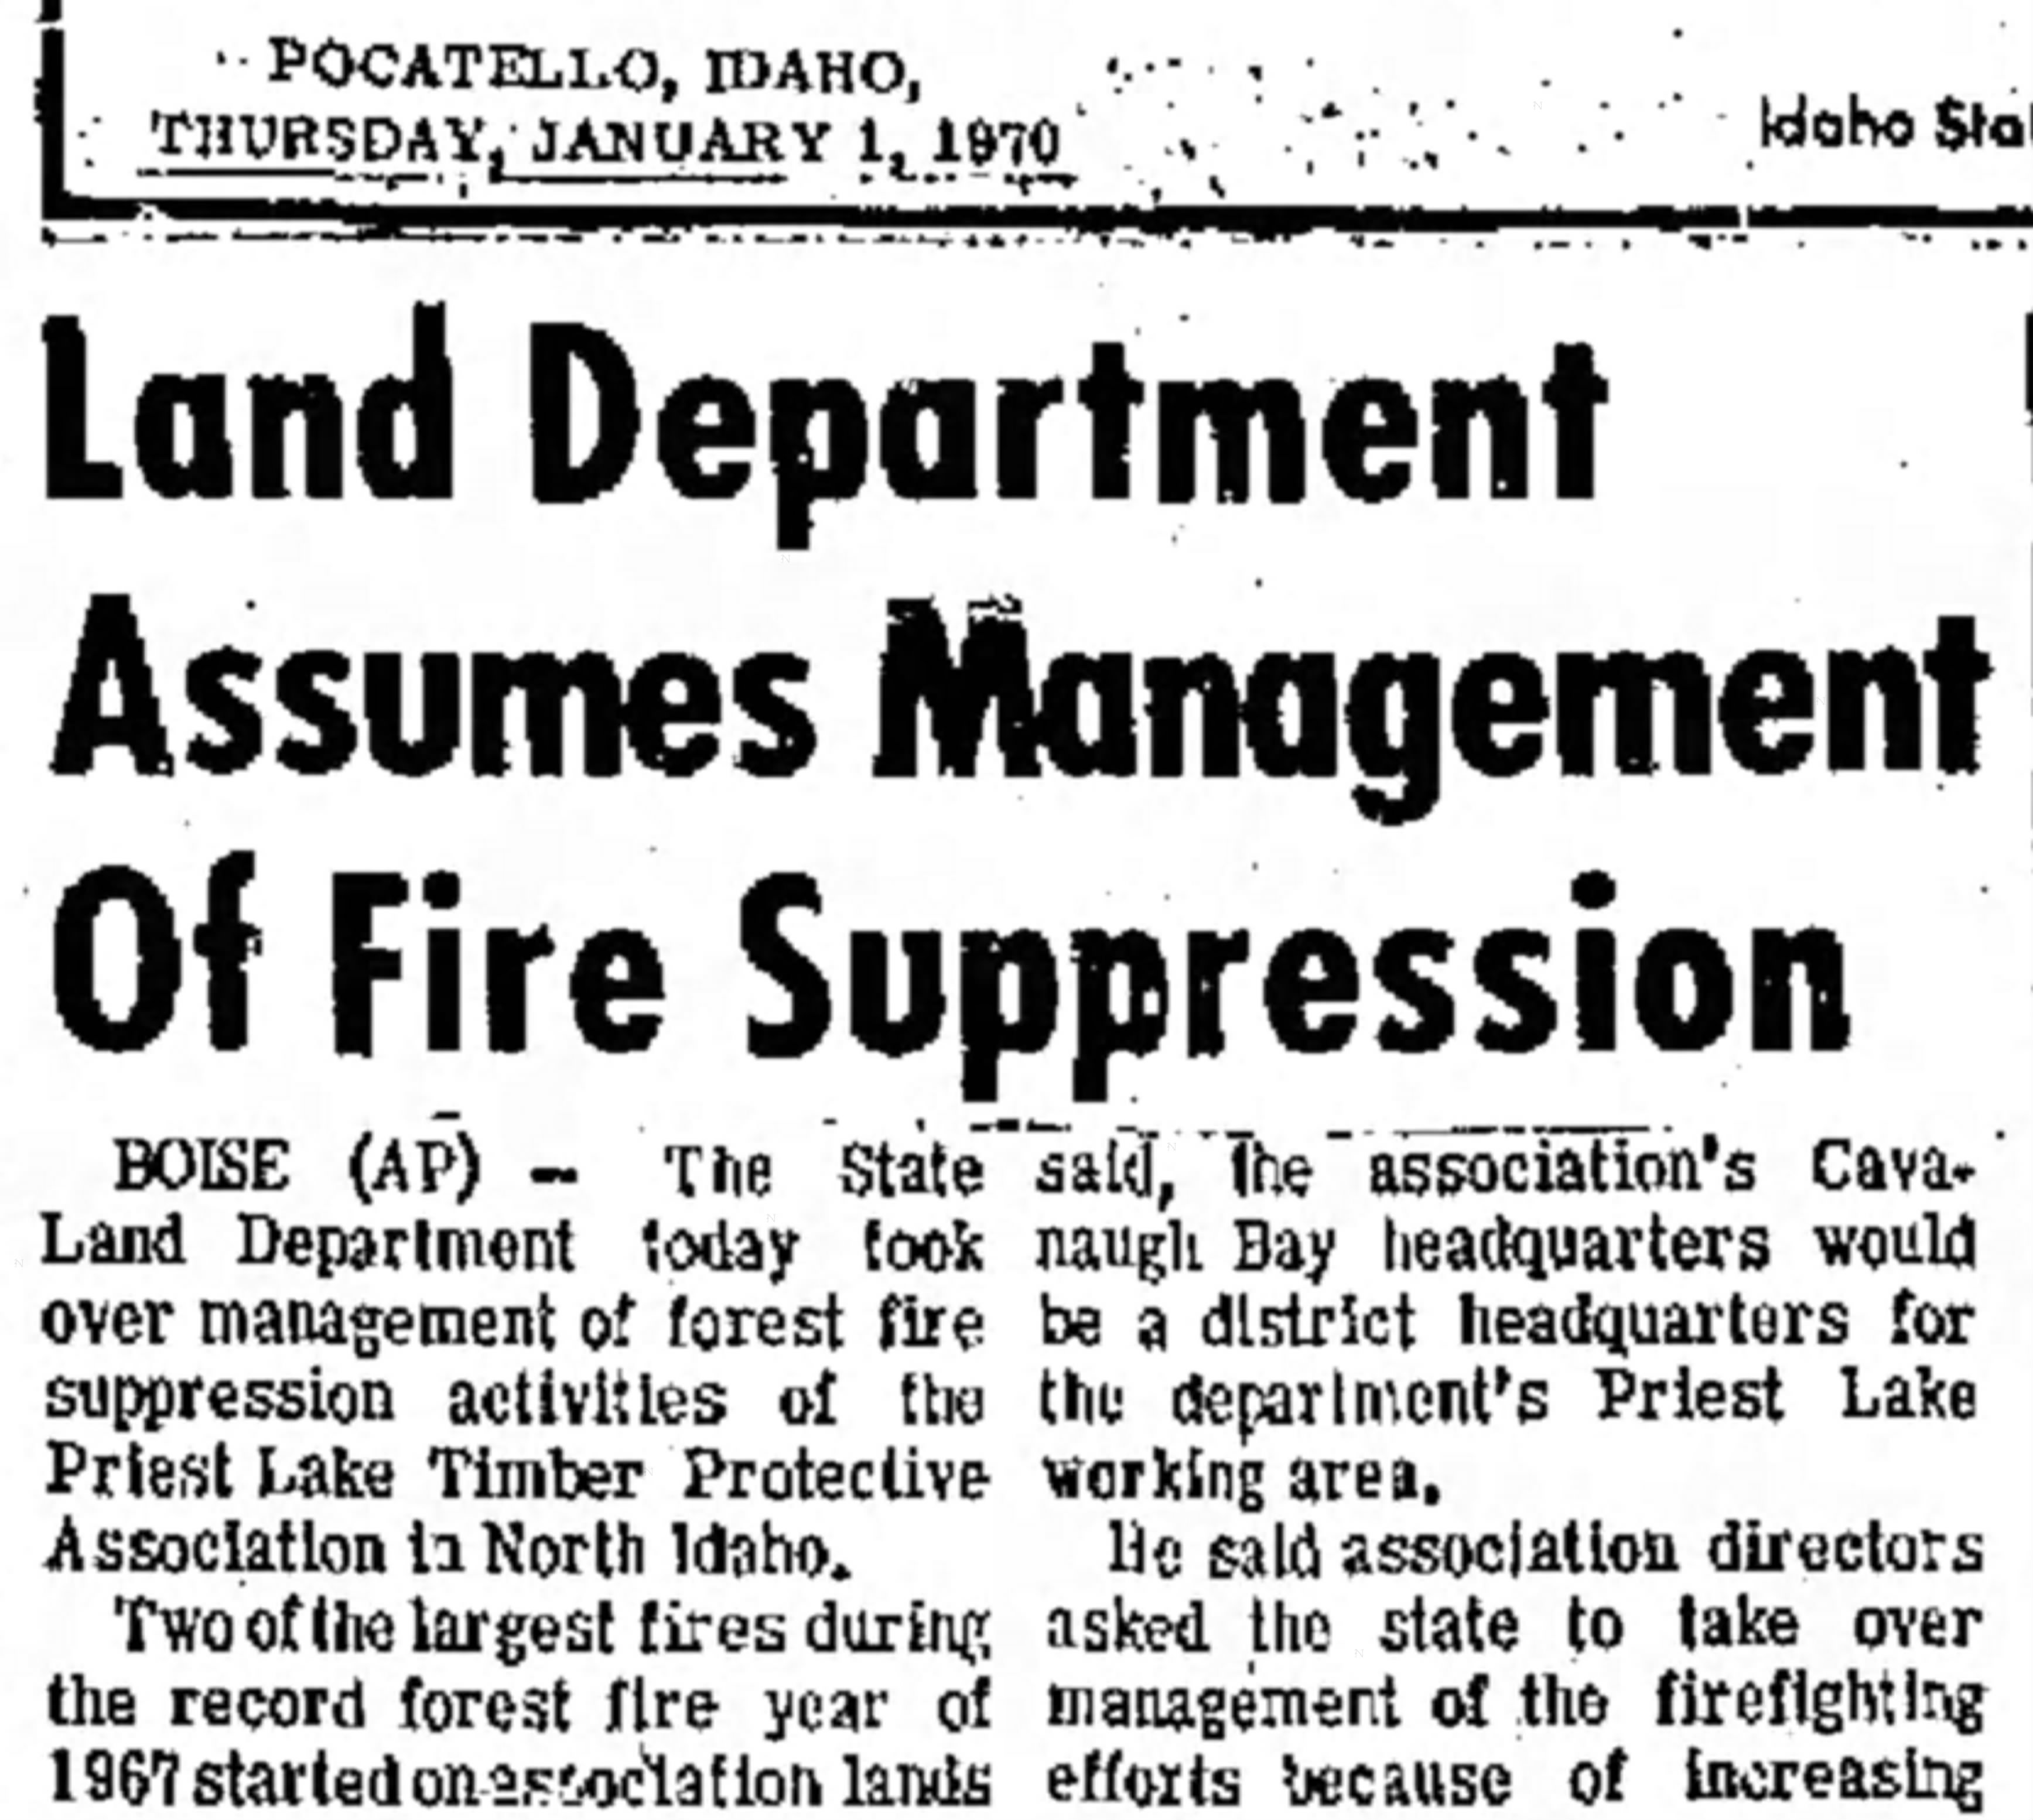
Like the misguided mindset of pre-1970s forest management, suppressing every fire in an effort to “protect” the forest, a process that Mother Nature was perfectly capable of performing for many millions of years without the “benefit” any human intervention, the “stewards” of our financial eco-system have consistently prevented the natural cleansing effect of major market downturns and financial crisis.


Worse yet, the Fed and their global central banker counterparts through their extraordinary “easy money” policies (i.e. ZIRP/NIRP, QE) literally spread combustible debris all over the global financial system in an foolish effort to manage a macro-economic “controlled burn” that only worked to warp our sense of value while simultaneously encouraging immense amounts of reckless speculative activity.

The “cause” of today’s inflation is the over-expansion of the monetary base and all associated money aggregates, the “effect” of inflation is rising prices, but between this basic relationship lies probably the most important stimulating factor, namely human psychology.

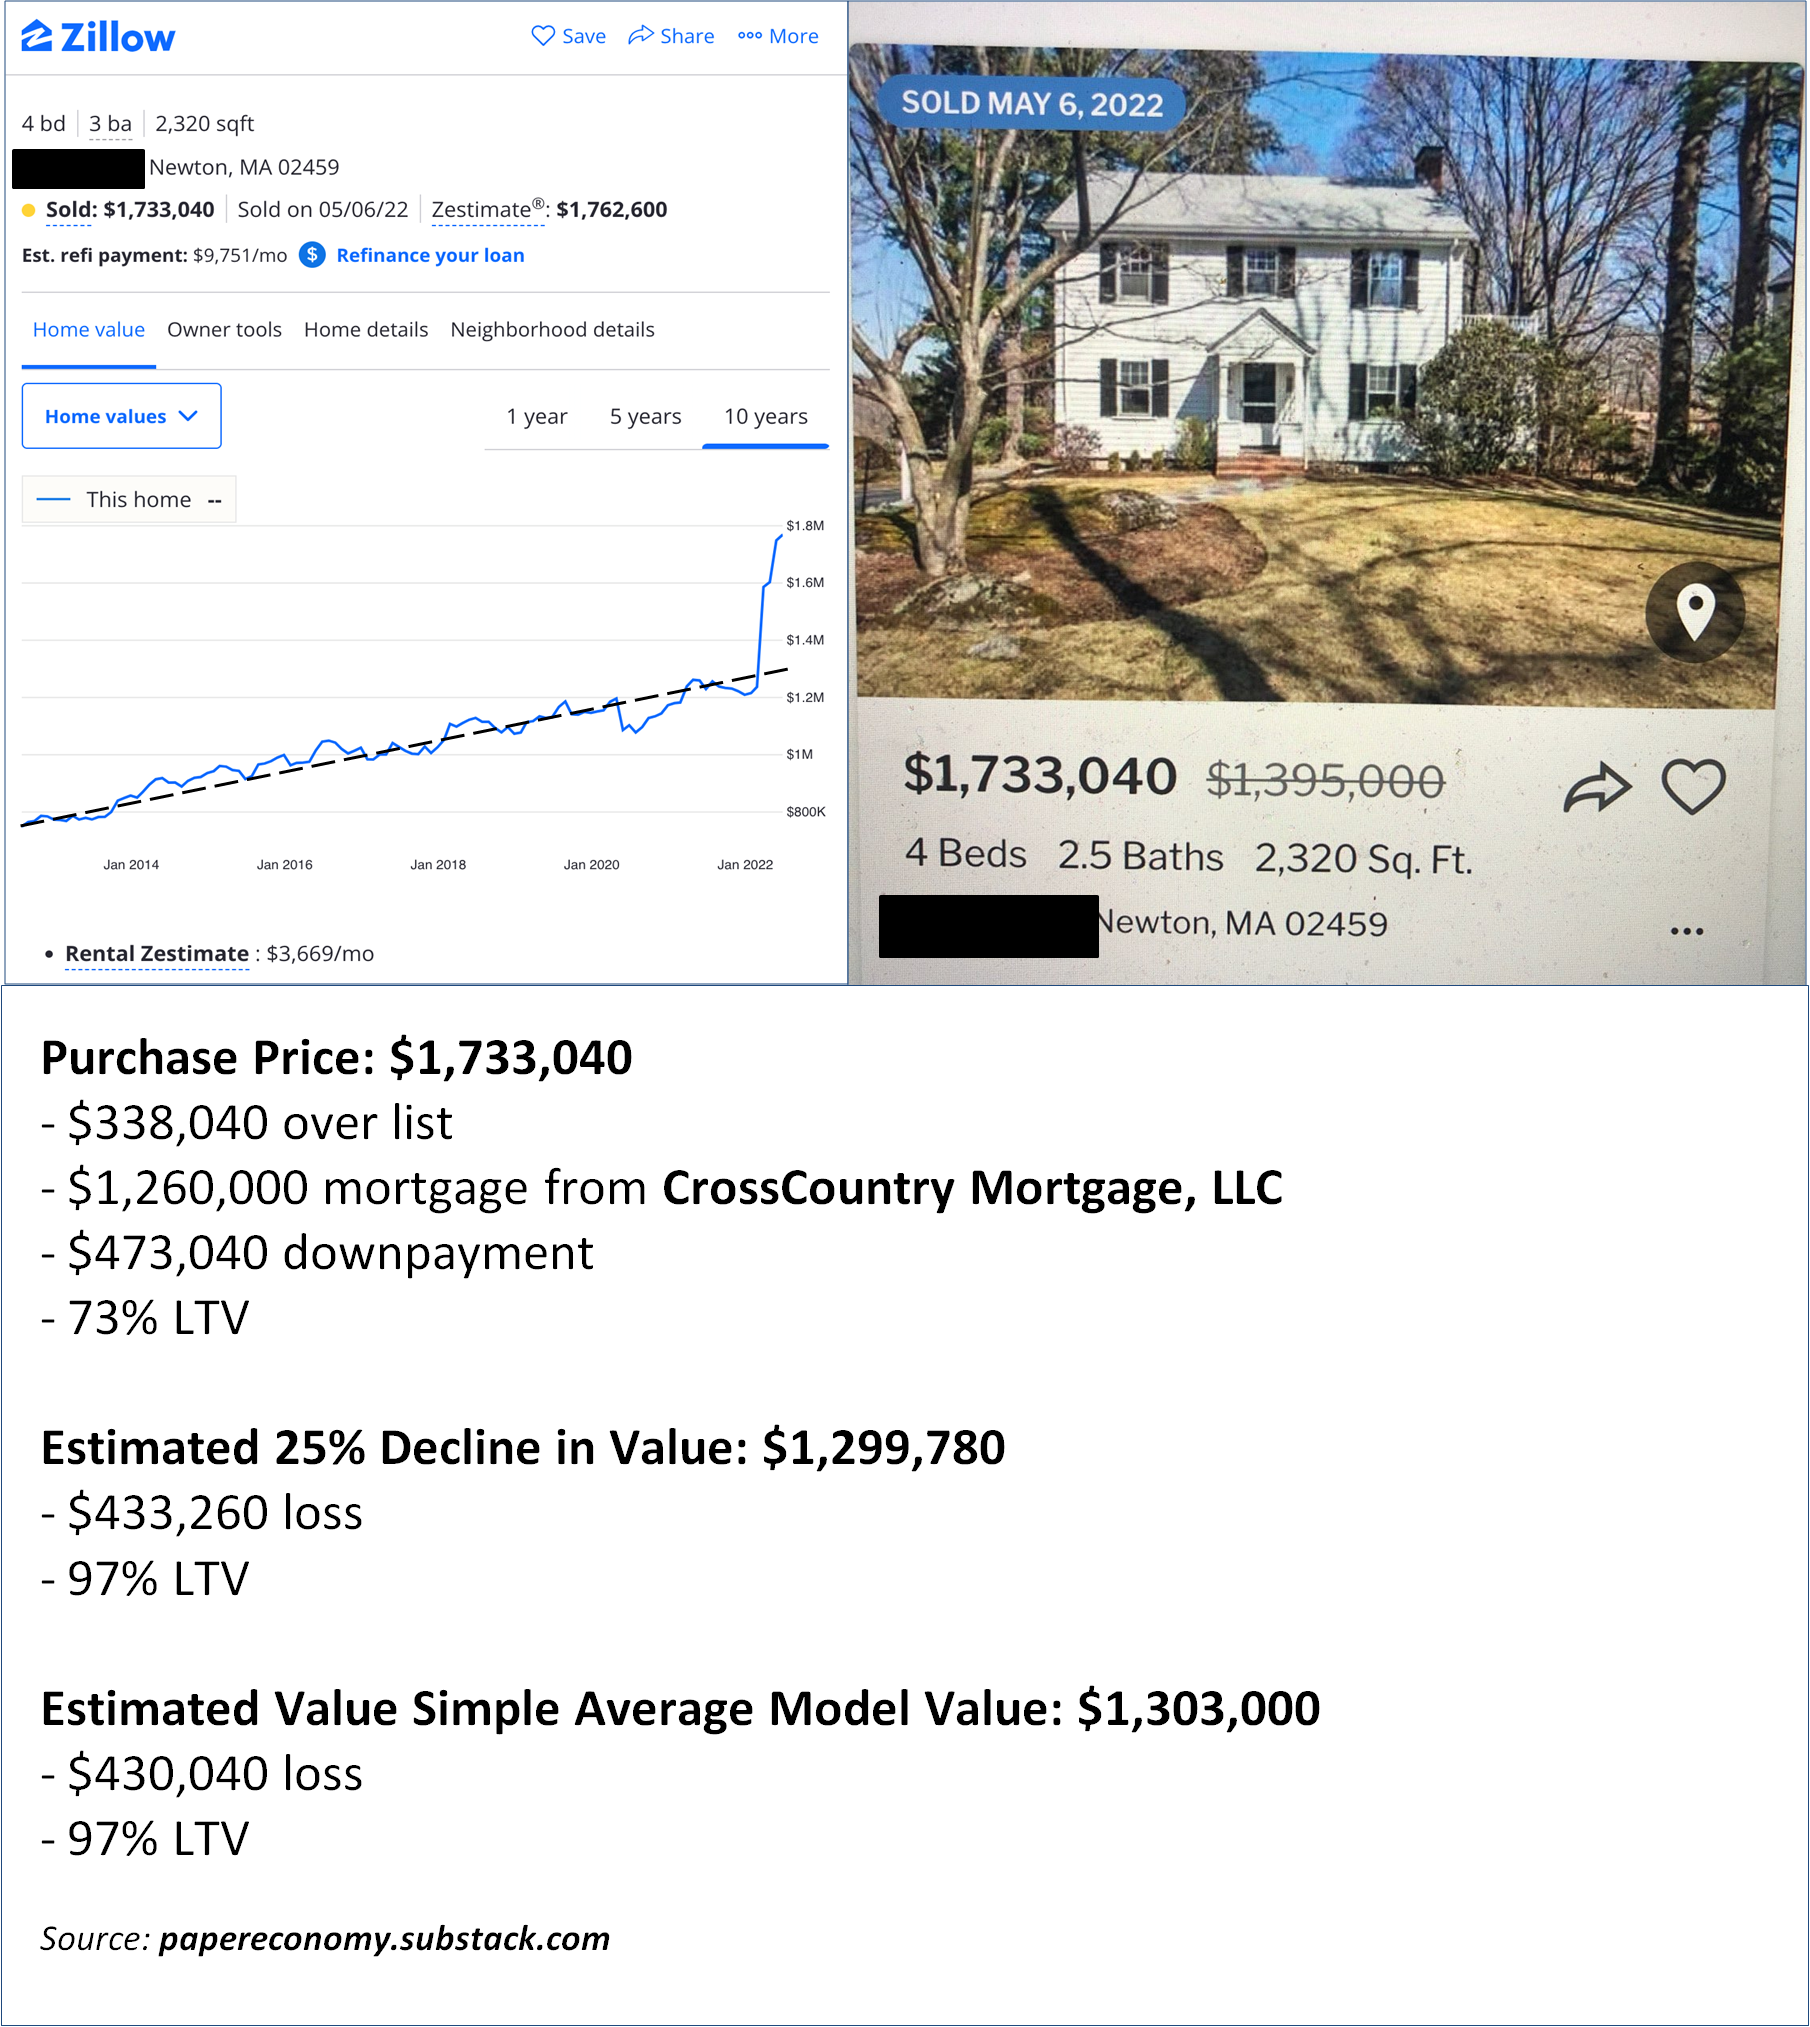
What makes a person pay an additional 9% for a consumer good this year than they did last year? Why would a prospective home buyer willingly compete in a bidding war that sends the final purchase price 30% over the original asking price and obviously out of line with the property’s historic valuation? Why would youth with nearly zero real wealth be pumping whatever meager “money” they do have into a stock trading app in the hopes of a quick payoff on shares of any company much less aging firms clearly in their twilight years? Why would an otherwise financially astute investor be duped into believing that he could purchase a tweet and further that it was worth nearly $5 million? How could an obviously strange deep-talking 19 year old Elizabeth Holmes con the venture capital community out of $700 million for a prospective innovation that could easily, with minimum due diligence, be shown to defy the limits of physical reality?

Delusions truly abound!

We are in an era where fantasy has replaced cold hard facts and market participants prefer to LARP their way through their life’s trajectory entertaining one outlandish concept or another rather than simply cultivating the real earned product of toil and time.

This outcome was not by accident either, but by the Fed (and their global central banking counterparts) and the Federal government’s choices. When the value of money is undermined, particularly as fundamentally as it has been over the last many decades, it distorts the human psyche and unleashes irrational wants, desires and perceptions leading to actions that would never be possible with harder earned real wealth in a more grounded real world.

In a high energy and highly preposterous environment like this, it only took the inevitable spark, the COVID-19 pandemic panic, to provide the final stimulus to light-up things and start an epic inflationary conflagration going and ultimately the greatest, most fundamental challenge of our time.

We need face up to this challenge and get back to the world of sound money and prudent behavior.

This coming economic reckoning holds the hope for a post-crisis reality that goes “back to basics” on many fronts albeit at the cost of massive asset price declines, a federal finance and budget catastrophe, a sharp increase in long term unemployment and a never ending list of financial (and real) suffering as the dreamy wild times of the bubble decades of the “Great Moderation” become distant memories.

The task at hand for the Fed at this critical moment, provided that they truly want to tackle inflation and right the wrongs of their prior policy, is to fully embrace a new era, the “Great Agitation”, and a shift of the macro-economy back in the direction of sound money.

This is no small task and is not accomplished with a rate hike here or there but rather a commitment to contract the monetary base, no matter how painful the process may be, stamping out speculative fevers while fully disabusing all market participants of the notion that “easy money” will ever been seen again in their lifetimes.

Painful as this process may be, it is the only true path forward to a world that retains the integrity of our traditional political and economic the systems.

If the Fed again panics in the face of the economic turmoil and pivots back to desperate money creation and inflation just to buy a measure more of “stability”, then we will be truly be repeating history as this latest empire simply degenerates into a modern Dark Age of meaningless chaos.

Monday, July 11, 2022

Forecasting the Coming Housing Collapse

Like this post? Consider subscribing to my Substack for additional insights and content today!

As the Fed’s rate tightening policy regime continues to put upward pressure on mortgage interest rates and the steadily worsening recessionary trends (and other notable economic headwinds) mount for the macro-economy, it’s becoming pretty obvious that the nation’s residential housing markets are in for a serious pullback.

The most important questions for the housing market now are when will we see the peak firmly established for home prices this cycle and what will be the pace and scale of the downturn?

I’ve developed a model to attempt to answer those questions using past trends as a general guide as well as a healthy dose of pure conjecture based on my first-hand experiences with our most recent past two housing downturns.

First, I want to note that while my outlook would probably be considered by many to be highly pessimistic, I had an equally pessimistic outlook for housing back in 2006 and, looking back on my posts from those years preceding the Great Recession, I think my take back then was actually spot inline or even a tad too optimistic for the times that were headed our way.

In general, my key principles for the dynamics of highly speculative and delusional markets and asset classes could be stated simply as “What goes up, must come down” as the bubble inflates and then, once the delusion has broken, the sentiment shifts to “The bigger they come, the harder they fall.”

In other words, speculative trends tend to overshoot, first on the up-side and then on the down but over long term, the primary function is ultimately a reversion to the mean.  In some cases, the “mean” might just be the zero-bound but in a fundamental asset class like housing; over the long haul, the trend should be a slow and steady (and far from exciting) random walk up and to the right, keeping up with inflation but no more and no less.  

As for the current moment, we are sitting at the nexus of a number of Fed induced “easy money” speculative delusions in the era of the “Everything Bubble”; Stocks, housing and alternative investments (cryptos, NFTs, SPACs, etc.) had all been (until recently) running white hot for at least the last two years while stocks and housing have been propped up and pumped full by ZIRP and QE policy for over the last thirteen years.

This makes comparing the current period for the housing market (or any other asset class for that matter) to past periods very difficult given that so much of the general economic activity that has surrounded us since 2008/09 is but a Fed induced fiction and we will never truly know what the fundamental trends would have looked like without all the market manipulation.

But, be that as it may, I have modeled out the trends using a simple quantitative approach that mirrors my “key principles” whereby I relate the size and scale of the boom to the extent of the bust and also, relate our current cycle to the past two cycles.

First, take a look at Robert Shiller’s long running nominal home price index (blue left axis) plotted with the year-over-year percent change (red right axis) monthly since 1953.  Note that this index is synthesized from several source indices as the S&P CoreLogic Case-Shiller only runs back to the 1980s.   

Notice that the scope and scale of each housing bubble since 1980s has been growing with each successive cycle.  Below is a table summarizing the 1980s, 2000s and the current 2022s cycle details:

Notice that the year-over-year (YOY) percent change for each cycle has been increasing by about a factor of 1.5 for each subsequent cycle.  While I don’t believe that this is some sort of magic factor, I’m going to take this as a general indicator that the current boom has just about reached is maximum upward thrust while also giving a sense of the scale of the minimum YOY when the downturn eventually kicks into gear.

Next, look at the chart below displaying the S&P CoreLogic Case-Shiller Home Price Index of the late 1980s era “Savings & Loan Crisis” boom bust cycle (a subset and not the full cycle) and notice that I have highlighted both the strongest monthly of year-over-year percent change (bright red bar at 2/1987) and the strongest monthly month-to-month percent change (bright green bar at 6/1987) as well as the weakest of both (most negative YOY percent change at 4/1991 and MTM at 11/1990).  

Let’s recall that while the Savings & Loan Crisis was a major event, the boom and bust primarily affected key cities of the east and west coast and their associated suburban property markets and did NOT generally express itself across the whole of the U.S. like the following “Great Housing Bubble” cycle ultimately did a decade later.

Since my plot is displaying the “National” S&P CoreLogic Case-Shiller Home Price Index and given that this home price boom and bust was largely regional, the cycle appears subdued by comparison to more recent cycles.

Next, look at the chart below displaying the S&P CoreLogic Case-Shiller Home Price Index of “Great Housing Bubble” boom bust cycle (a subset and not the full cycle) and notice again that I have highlighted both the strongest and weakest monthly YOY and MTM gains and losses.

Clearly, the “Great Housing Bubble” ran much longer, reached a much higher level and ultimately collapsed much harder than past cycles.  Remarkably, it took about 174 months to reach the peak and another 67 months to trough with a whopping 143% peak increase which was eventually reduced to a net 77% increase after a 27% decline during the bust.

Finally, look at the chart below which displaying the S&P CoreLogic Case-Shiller Home Price Index of “Everything Bubble” boom bust cycle (a subset and not the full cycle) with a projected price trend (all data within the yellow band) running all the way to 2030.

My forecast for the price trend going forward is pretty simple and involves the following key assumptions:

1. The Month-to-Month (MTM) percent change of 2.58% seen in March of 2022 will be the largest monthly increase we will see for this cycle given that the S&P CoreLogic Case-Shiller is a three month moving average and will now (going forward) start to capture price dynamics reflecting the increasing mortgage interest rates that began to surge in earnest during March.

2. We are very near the maximum Year-on-Year (YOY) percent change which I estimate will reach about 1.5x the maximum YOY percent change seen in the last cycle (14.5%) at 21-23% and will come later this year at which point all subsequent monthly YOY reads will trend continuously lower till they ultimately turn negative into the depth of the decline.

3. The general downtrend in prices will play out similarly to the “Great Housing Bubble” cycle with the exception that the monthly declines will be a bit more intense given the more aggressive price run-up and the abrupt reversal in mortgage rates.

I will continue to update this projection as new S&P CoreLogic Case-Shiller data settles as well as revise my overall thesis and key assumptions but at the moment it appears to me that the strongest monthly MTM change was seen in March, we are closing in on the largest annual YOY change coming likely this November and that the peak in prices will probably be some time next year based primarily on the effects that increasing mortgage rates have on market activity.

Wednesday, July 06, 2022

The Real Great Recession

Like this post? Consider subscribing to my Substack for additional insights and content today!

It’s time to face the facts, recession is here, not “officially” of course since it takes the NBER with a boat load of highly revised and settled macro-economic data to officiate that fact, but “technically” and in a fashion that is widely felt.

Q1 2022 registered a first negative real GDP print for this cycle (i.e. the cycle that started after the COVID pandemic induced mini-recession) and only the third (but most significant) time a quarter turned negative (if you leave off the COVID debacle) since the end of 2008’s Great Recession.

Add to that the fact that the Fed itself is now forecasting a second negative print for Q2 2022 and its becoming pretty evident that the economy is in the middle of a significant down shift that is only going to get worse with the full realization of the impact of each major headwind. 

The data visualization below (click for larger dynamic version) is displaying the Real GDP percent change from the preceding period (in blue on the left axis), the Atlanta Fed’s GDPNow Real GDP estimate annualized rate (in red on the left axis) and the Chicago Fed’s Brave-Butters-Kelly (BBKI) leading sub-component of GDP (green on the right axis).  In summary, Q1 saw an actual 1.6% contraction in real GDP from the preceding period, the Fed is currently estimating -2.0% annualized contraction in GDP while one of the Fed’s high frequency models is forecasting nearly a -3.0% going forward. 

The economy is currently contending with rising consumer prices primarily coming from general monetary inflation stimulated by the Fed’s own “easy money” policies over the last 13+ years, exploding food and energy costs with notable product shortages, an evolving stock market rout with an ever looming crash-out end-game, a quickly souring national housing market fragilized by speculation and loose lending and now traumatized by the abrupt reversal of interest rates, global uncertainty coming from the now obvious quagmire that is the war in Ukraine and a stymied supply chain from a China unwilling or unable to return to a post-COVID normal order.

That would be a sufficient array of challenging issues for even the most competent government and economic order to face up to but one gets the sense that our current “leadership” is woefully out-classed and simply incapable of even waging the most modest of effective responses to even just one of those many issues.

With all of that stated “gloom”, where do we go from here? The answer is pretty simple “doom” or in other words, “down”.  And not just a little down mind you, way back down to 2008 and beyond as genuine “fact” finally catches up with the Fed’s economic “fiction” and yields the compounded negative real return on the massively appalling mal-investment that was the mop-up of the Great Financial Crisis.

The “Real Great Recession” is now looming as the reckless policy response on the part of the Fed and the Federal government in the wake of the 2008 Great Recession, endlessly pumping, priming and backstopping in an effort to simply “kick the can down the road” thereby softening the blow for that era’s legion of weak hands is now realized to have come at an enormous expense of today’s totally FUBAR-ed bag-holders.

But this “doom” does not have to represent only misery and depression.

An epic economic reckoning will bring enormous opportunities as fundamental bouts of “creative destruction” run roughshod over a cornered economic system with no escape and the only path forward leading through the pain.

Business will go crash-out, households will go bust and paper wealth will vaporize and fade from memory taking with it the rampant fever for “easy money” fueled speculation while local, state and the federal governments, severely constrained, will be unable to do much more than simply attempting to manage keeping the peace.

Bleak outlook indeed, but as that famous Stoic philosopher, Seneca the Younger put it “Nothing lasts forever, few things even last for long, all are susceptible of decay in one way or another; moreover all that begins also ends.” Or as Semisonic more optimistically put it a little more recently, “Every new beginning comes from some other beginning's end.”

Tuesday, July 05, 2022

A Real Mean Reversion

Like this post? Consider subscribing to my Substack for additional insights and content today!


 One of the major differences between our current housing boom and the epic housing run-up and associated crash that ultimately led to the “Great Recession” is in the supposed quality of buyers, or more precisely, the underwriting standards lenders use when making home loans as well as the soundness of the loan products and features they offer.

Without a doubt, lending standards by 2005/06/07 had become completely detached from reality with 100% loan-to-value, no-interest, reverse amortization, no-income verification, sub-prime being some of the various means by which the housing finance system kept the party going (loan volume) even after prices had risen well out of reach for many prospective home buyers.

In the aftermath of the epic financial meltdown that ensued, there was a notable effort by Federal regulators to understand what went wrong, and further, to take measures to prevent such egregious activities in the future.

The Dodd-Frank “Wall Street Reform and Consumer Protection” Act had as a provision the “Mortgage Reform and Anti-Predatory Lending Act” which sought in part to tighten up the process of mortgage origination in order to:

It is the purpose of this section and section 129C to assure that consumers are offered and receive residential mortgage loans on terms that reasonably reflect their ability to repay the loans and that are understandable and not unfair, deceptive or abusive.

To that end there are the following two important sub-sections (NOTE: Dodd-Frank is an enormous act with many provisions; these are just two small samples of items focused specifically on mortgage origination standards):

Subtitle B: Minimum Standards for Mortgages

IN GENERAL.—In accordance with regulations prescribed by the Board, no creditor may make a residential mortgage loan unless the creditor makes a reasonable and good faith determination based on verified and documented information that, at the time the loan is consummated, the consumer has a reasonable ability to repay the loan, according to its terms, and all applicable taxes, insurance (including mortgage guarantee insurance), and assessments.

This section goes on to detail tighter rules for regulating, multiple loans (borrowers has subordinate loans on same property), income verification, no-interest options, negative amortization options and other lending phenomena that contributed to the mortgage mania of that era.

Subtitle F: Appraisal Activities

IN GENERAL.—A creditor may not extend credit in the form of a subprime mortgage to any consumer without first obtaining a written appraisal of the property to be mortgaged prepared in accordance with the requirements of this section. 

This section goes on to detail tighter rules for regulating the appraisal process of a property that will be financed using a “high-risk” subprime loan. 

Taken together, these two sub-sections point to one major flaw in the legislative financial regulatory process in that it is at best always backward looking, specifically addressing practices that occurred in the past that had led to financial crisis.

Whether there is any sense to even trying to regulate future financial activities, is not the topic of this post, but suffice to say, the Dodd-Frank mortgage origination related provisions focused heavily on the activities that led to the Great Recession and didn’t attempt to regulate other novel methods that might be employed in future speculative episodes.

One area that I have taken an interest in is in the non-conforming “jumbo” loan market and particularly in my own market of Boston where throughout 2020, 2021 and on into 2022, I have witnessed some truly reckless behavior on the part of borrowers and lenders.

Following up on my prior post on the subject, I dug a little deeper into the homes that I have highlighted previously to better understand the nature of the debt that financed these reckless purchases.

From a traditional mortgage lending perspective, these purchases appear pretty sound given that the average loan-to-value (LTV) was about 70% (i.e. 70% loan, 30% deposit), all mortgages were simple 30-year fixed rate loans (no risky options or even a single ARM) and I assume that all incomes were verified.

But considering that each of these buyers over-bid the listing price by on average a whopping 30%, one might draw a different conclusion.

First, below is a simple average model for pricing the Boston housing market that I developed using the S&P CoreLogic Case Shiller Home Price Index (CSI) for Boston.  This model, superimposed on a Zillow price history, simply uses the CSI to calculate the price trend line with 2016-2019 based on actual annual price changes and 2020-2022 based on an average annual price change from the trailing eight (8) years.

My general premise with this model is that 2020 through 2022 represented an absurdly anomalous period where lending rates were exceptionally low and buyers (as a result of COVID-19 hysteria) were simply not acting prudently.

As you can see from the model, there is a significant risk of “mean reversion” for the nation’s severely overheated housing markets as interest rates rise and prices fall meeting a more fundamental balance that, once materialized, will call into question the financial soundness of the loans backing up these properties.

If, given the emerging headwinds for the macro economy and housing specifically, we see a 25% pullback in home prices in Boston (not inconceivable given the ferocity of the price appreciation in just the last two years as well as the scale of prior pullbacks of about 16% after the late-80s S&L crisis and 18% after the Great Recession), then these homes would all have an average LTV of about 92%, a much less sound financial footing for these buyers and lenders.

Further, many of the homes could fall even more sharply given how far off the simple average price trend (the model) the buyers pushed the purchase with their manic bidding.  

The following is a selection of three homes from my original post, annotated with the simple average price model as well as the mortgage details to illustrate the point:


Note that I calculated the LTV as they stood on the day of settlement as well as what the LTVs would be after both a 25% pullback in prices as well as with respect to the simple average price model forecast of the more fundamentals-based value. 

The loophole in the lending standards for this cycle appears to have been that home appraisals were either unable to accurately account for the outlandish price appreciation occurring in the market or were simply roundly ignored given the fact that borrowers came to the table with 20%-30% down-payments and had good credit histories.

Prudent lenders would have evaluated the appraisal to determine a more fundamental valuation and either demanded more down-payment from the bid-happy borrowers to account for the additional risk or simply rejected the transactions outright.

For example, for the first property above, the fundamental value of the home at the time of purchase was probably closer to about $1,300,000 but it was bid up to $1,720,000 or about $420,000 over its fundamental price.

If the lender had been more prudent, they would have either walked away from the transaction or demanded that the borrower come up with about $800,000 for the deposit instead of the meager $400,000 that the borrower actually paid.

This would have resulted in a loan of about $920,000 against an $800,000 deposit for a very healthy 53% LTV which would have been well fortified against any oncoming economic crisis-driven home price decline.

Obviously, the lender didn’t perform this level of due-diligence because the borrow could not afford the additional deposit and all parties involved (lender, broker, lawyers, buyer and seller) simply wanted to stack up another closed transaction.

I suspect that my small sample is clearly demonstrating something important about the housing market dynamics this cycle, namely that there is real, yet to be fully realized, systemic risk coming from the prime lending market particularly for the performance of privately funded “jumbo” loans.