 Looking back at October’s results (released throughout November) it’s now unequivocally obvious that the nation’s housing markets, having fully transcended the mania that existed primarily in the first half of the decade and now, in its aftermath, after being dramatically and irreparably impaired by the unwinding of the resultant mortgage-credit debacle, are now hurtling headlong into a dramatic new leg down.
While housing demand continues to slow and inventories swell far beyond historic levels, the credit markets that had provided such a plentiful supply of cheap Jumbo mortgages remains non-existent.
Homebuilders have now clearly accepted the severity of the recession and are re-pricing accordingly but, as is typical, the existing home sellers remain behind the curve.
Additionally, there are tentative signs that the commercial real estate market (CRE) is now beginning to feel the effects of the ongoing credit debacle and consumption pullback resulting in a sharp pullback in prices and swelling inventory of vacant space.
Finally, although the second preliminary installment of the Q3 2007 GDP showed strong results, most notably coming from exports, the mainstay consumer and CEO confidence surveys are now clearly showing significant trepidation particularly with respect to future prospects for the strength of the economy.
The Pending Home Sales Report, the most leading existing home sales indicator, again showing truly stark and horrendous continuation of the historic decline to residential housing on a year-over-year basis, both nationally and in every region.
We are now firmly heading down the second slope of the pullback in residential housing demand with the Northeast, Midwest, West and the National regions having now fallen over 30% BELOW the seasonally adjusted home sales activity recorded in 2001, the first year Pending Home Sales were tracked.

 The National Association of Realtors (NAR) released their ninth consecutive downward revision to their annual home sales forecast for 2007 putting the current outlook far below the “rose colored” initial predictions from the start of the year.
 NAR’s Existing Home Sales Report showing perfectly clearly, that demand for residential real estate, for both single family and condos, has now taken a new and substantial leg down uniformly across the nation’s housing markets likely as a direct result of the momentous and ongoing structural changes in the credit-mortgage markets.
Furthermore, the latest quarterly results for existing home sales shows that, on a year-over-year basis, home sales are now falling in every state except for Vermont and North Dakota (see chart below and click for larger version and note that NH and Idaho don’t report sales data) and even those states sales growth are anemic.


 Homebuilder confidence is now sitting AT OR BELOW the worst levels ever seen in the over 20 years the data has been being compiled.
This suggests that the current severe correction has surpassed all other events seen in the last 22 years and is now firmly in uncharted territory.
 The Census Department’s New Residential Construction Report firmly indicates a new leg down in the decline for residential construction showing substantial declines on a year-over-year and month-to-month basis to single family permits both nationally and across every region.
The Census Department’s New Residential Home Sales Report for October that again confirmed the hideous falloff in demand for new residential homes both nationally and in every region as well as reporting significant downward revisions to July, August and September’s results.
As with prior months, home sales and median prices are still declining significantly, with the national measure of sales dropping a truly ugly 23.5% and the median selling price declining a whopping 13.02% as compared to October 2006.
The September 2007 results of the S&P/Case-Shiller home price indices continued to show significant weakness for the nation’s housing markets with 13 of the 20 metro areas tracked reporting year-over-year declines and now ALL metro areas showing declines from their respective peaks.
Topping the list of peak decliners are Detroit at -12.77%, Tampa at -11.74%, Miami at -11.13%, San Diego at -10.99%, Phoenix at -9.74%, Las Vegas at -9.08% and Washington DC at -8.92%.


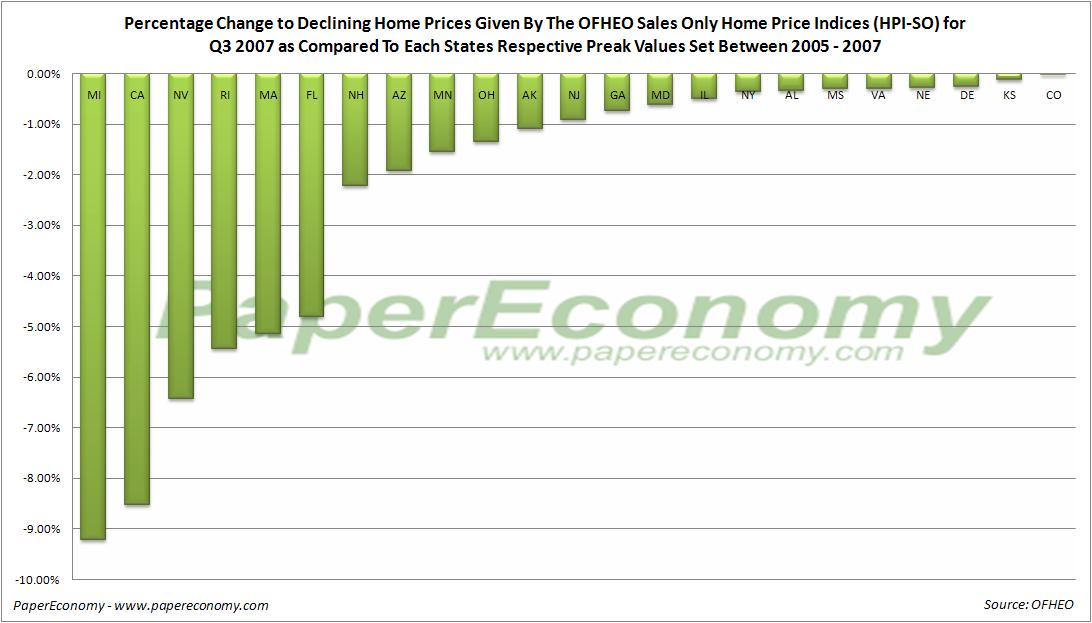
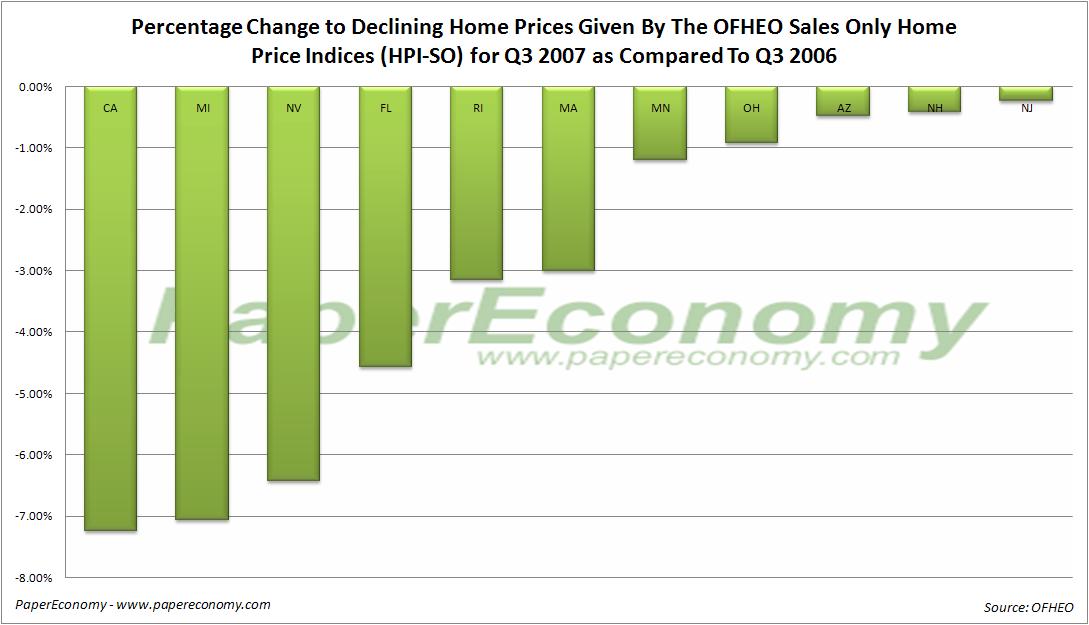
 The Office of Federal Housing Enterprise Oversight (OFHEO) released their Q3 2007 home price indices showing continued deceleration of home price appreciation in most regions as well as a broadening of outright declines now including 23 states declining from their respective peaks and 11 states declining on a year-over-year basis.
Topping the list of peak decliners by state is Michigan at -9.22%, California at -8.52%, Nevada at -6.43%, Rhode Island at -5.45%, Massachusetts at -5.14%, Florida at -4.81% and New Hampshire at -2.22%.
Topping the list of year-over-year decliners by state is California at -7.24%, Michigan at -7.07%, Nevada at -6.43%, Florida at -4.56%, Rhode Island at -3.16% and Massachusetts at -3.01%.
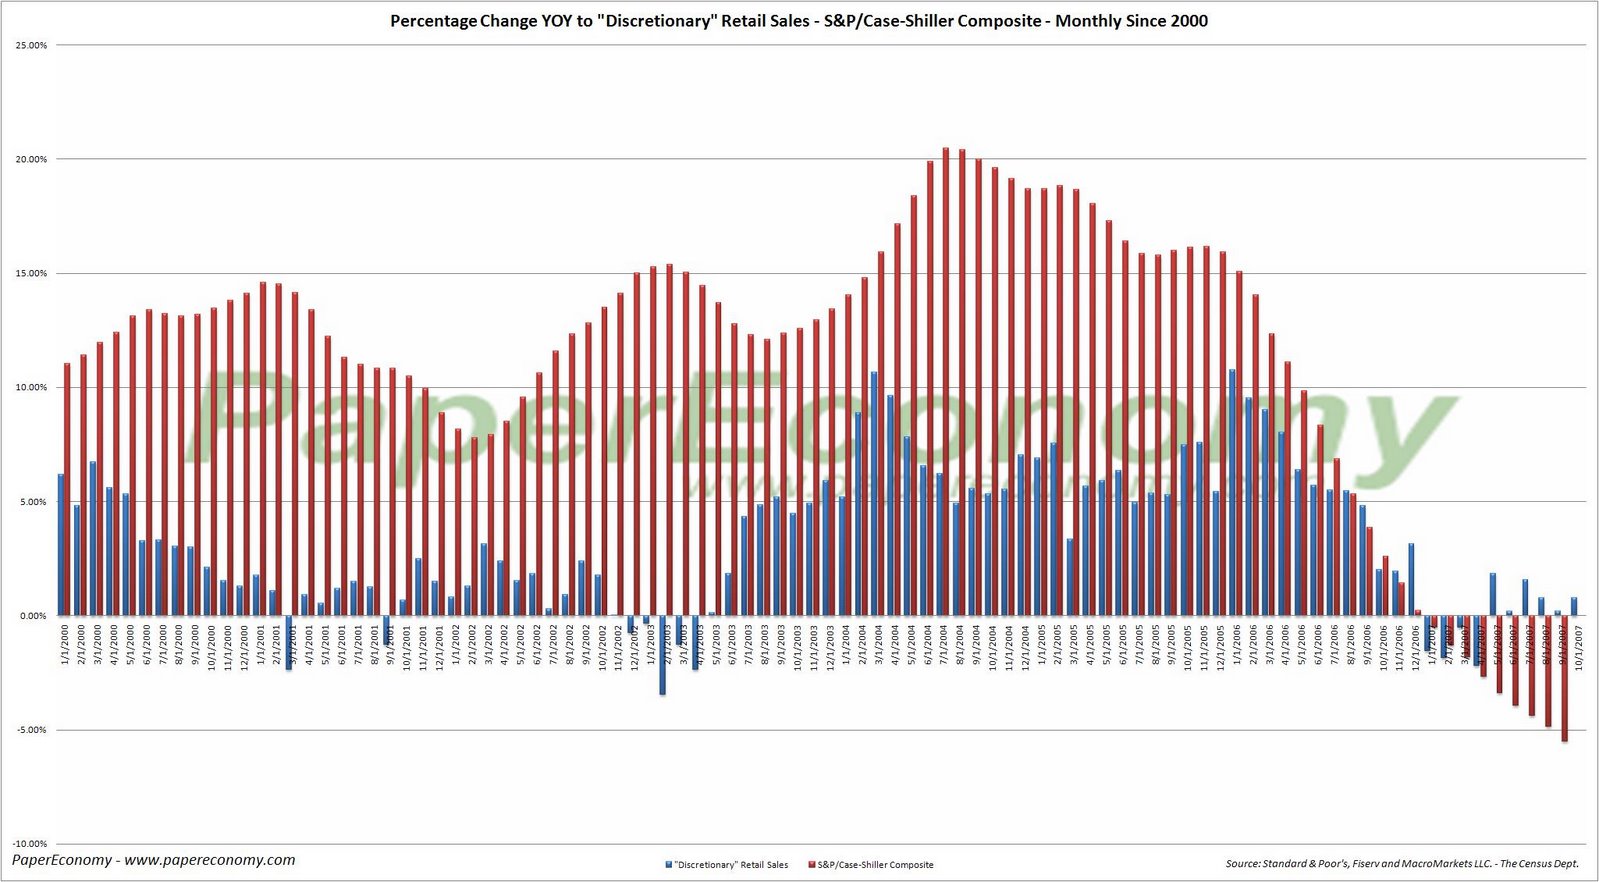
 The housing weakness still appears to be contributing to a pullback in the retail sales of the most discretionary goods although I will continue to revise the procedures for determining this correlation later this month.
 Countrywide Financial (NYSE:CFC) continues to register tremendous borrower stress as delinquencies and foreclosures are continuing to remain at troubling levels with delinquencies climbing 32.96% and foreclosures continuing to soar over 112% since October of 2006.
 The latest release of the Reuters/University of Michigan Survey of Consumers showed in unequivocal terms that the US consumer is feeling the burn from declining home values, increased fuel costs and a general uncertainty about the future of the economy.
The Index of Consumer Sentiment fell 17.37% as compared to November 2006 mostly as a result of consumers’ expectations of future economic prospects.
The Index of Consumer Expectations (a component of the Index of Leading Economic Indicators) fell a whopping 20.43% below the result seen in November 2006.
As for the current circumstances, the Current Economic Conditions Index fell 13.68% as compared to the result seen in November 2006.
 The Federal Reserve released their monthly read of industrial production showing a decrease of 0.5% from September and a 1.8% increase since October 2006.
More importantly though, production of “final product” consumer durable goods have been showing some recent weakness, with particularly significant declines coming specifically from home appliances, furniture and carpeting.
 There has been growing speculation that the commercial real estate (CRE) markets will inevitably follow the lead of the residential markets down to a recessionary correction.
After having some substantial growth between 2003 and Q2 2007 (particularly during 2005 – 2006), there has been a precipitous 2.5% drop in Q3 2007, a drop that MIT/CRE Director David Geltner sees as non-trivial.
"The fall in our index is the first solid, quantitative evidence that the subprime mortgage debacle, which hit the broader capital markets in August, may be spreading to the commercial property markets."

 The preliminary GDP report for Q3 2007 showed an increase in the severity of the drag coming from the decline in residential fixed investment, that is, all investment made to construct or improve new and existing residential structures including multi–family units, with the current quarterly fall-off registering a whopping decline of 19.7% since last quarter while shaving 1.03% from overall GDP.
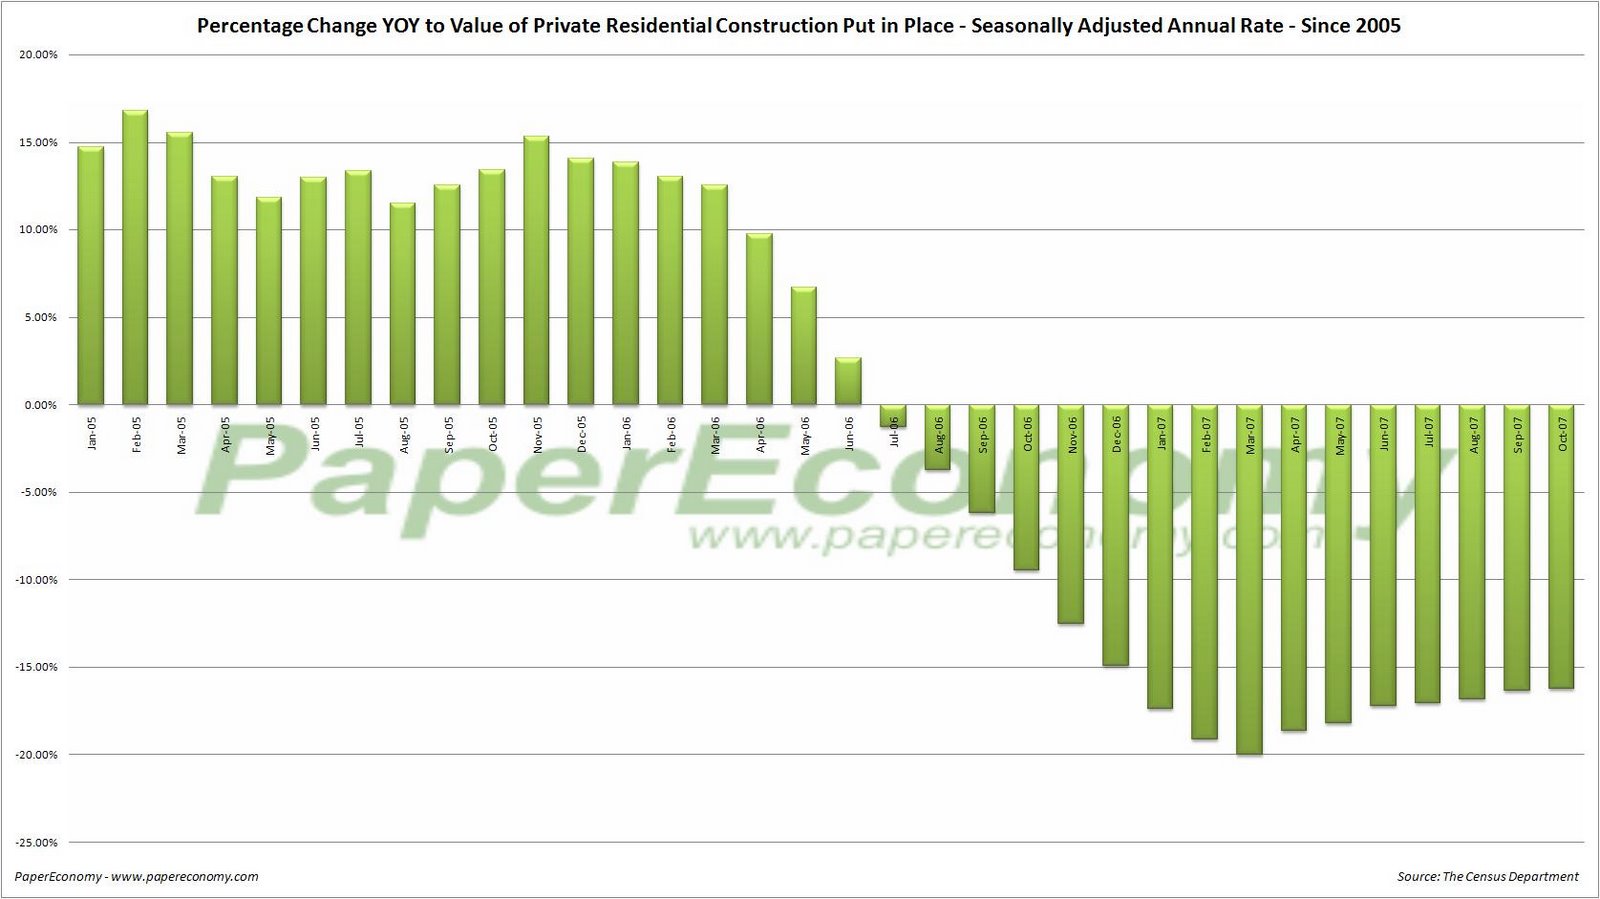
 Finally, the Census Department’s Construction Spending report for September again demonstrated the significant extent to which private residential construction spending is contracting.
With the weakening trend continuing, total residential construction spending fell -16.23% as compared to October 2006 and 27.63% from the peak set in February 2006 while private single family construction spending declined by a grotesque -26.41%.