Wednesday, October 31, 2007

I Give You... Bernancula!


Quick! Head for the hills!

Oh well, look at it this way…

He may devalue your currency and even make you pay through the nose for food and fuel but at least he’s not sucking your blood!... yet!

BOO!

Happy Halloween from PaperEconomy!

GDP Report: Q3 2007 Advance

Today, the Bureau of Economic Analysis (BEA) released their first installment of the Q3 2007 GDP report showing a better than expected growth rate of 3.9%, buoyed by strength in, among other things, nonresidential structures, outstanding exports of goods, and federal, state and local government spending while continuing to be weighed down by tremendous weakness to fixed residential investment.

Residential fixed investment, that is, all investment made to construct or improve new and existing residential structures including multi–family units, renewed its historic fall-off registering a whopping decline of 20.1% since last quarter while shaving 1.05% from overall GDP.

Housing continues to be, by far, the most substantial single drag on GDP subtracting an amount greater than the contributions made by all personal consumption of durable (cars, furniture, etc.) and non-durable goods (food, clothing, gasoline, fuel oil) during the quarter.

The following chart shows real residential and non-residential fixed investment versus overall GDP since Q1 2003 (click for larger version).

Reading Rates: MBA Application Survey – October 31 2007

The Mortgage Bankers Association (MBA) publishes the results of weekly applications survey that covers roughly 50 percent of all residential mortgage originations and tracks the average interest rate for 30 year and 15 year fixed rate mortgages as well as application volume for both purchase and refinance applications.

The purchase application index has been highlighted as a particularly important data series as it very broadly captures the demand side of residential real estate for both new and existing home purchases.

The latest data is showing that the average rate for a 30 year fixed rate mortgage decreased since last week to 6.15% while the purchase volume decreased 0.7% and the refinance volume increased 9.2% compared to last weeks results.

It’s important to note that the data is reported (and charted) weekly and that the rate data represents average interest rates, and the index data represents mortgage loan application volume for home purchases, home refinances and a composite of all loans.

The following chart shows how the principle and interest cost and estimated annual income required to cover the PITI (using the 29% “rule of thumb”) on a $400,000 loan has changed since January 2007.

The following chart shows the average interest rate for 30 year and 15 year fixed rate mortgages over the last number of weeks (click for larger version).

The following charts show the Purchase Index, Refinance Index and Market Composite Index since January 2007 (click for larger versions).


Tuesday, October 30, 2007

S&P/Case-Shiller: August 2007


Today’s release of the S&P/Case-Shiller home price indices for August continued to show significant weakness for the nation’s housing markets with 15 of the 20 metro areas tracked reporting year-over-year declines and now virtually ALL (except Charlotte NC which changed 0.0%) metro areas showing declines from their respective peaks.

Topping the list of peak decliners are Detroit at -12.18%, Tampa at -10.57%, San Diego at -9.43%, Miami as -9.11%, Washington DC at -8.38%, Phoenix at -8.16% and Las Vegas at -7.65%.

Additionally, both of the broad composite indices showed accelerating declines slumping -5.28% for the 10 city national index and -4.53% for the 20 city national index on a peak comparison basis.

Also, it’s important to note that Boston, having been cited as a possible example of price declines abating, has now again resumed its decline dropping -3.62% on a year-over-year basis and a solid -6.32% from the peak set back in September 2005.

As I had noted in prior posts, Boston has a strong degree of seasonality to its price movements and with both the seasonal drop in sales and the recent stunning new decline to sales as a result of the disappearance of Jumbo and Alt-A loans, Boston will likely continue on yet another significant leg down in prices.

To better visualize the results use the PaperEconomy S&P/Case-Shiller/Futures Charting Tool and be sure to read the Tutorial in order to best understand how best to utilize the tool.

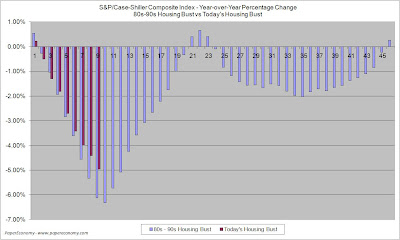
Additionally, in order to add some historical context to the perspective, I updated my “then and now” CSI charts that compare our current circumstances to the data seen during 90s housing decline.

To create the following annual charts I simply aligned the CSI data from the last month of positive year-over-year gains for both the current decline and the 90s housing bust and plotted the data with side-by-side columns (click for larger version).

What’s most interesting about this particular comparison is that it highlights how young the current housing decline is, having only posted four consecutive year-over-year (YOY) monthly declines to home prices.

Looking at the actual index values normalized and compared from the respective peaks, you can see that we are only ten months into a decline that, last cycle, lasted for roughly fifty four months during the last cycle (click the following chart for larger version).

The “peak” chart compares the percentage change, comparing monthly CSI values to the peak value seen just prior to the first declining month all the way through the downturn and the full recovery of home prices.

In this way, this chart captures ALL months of the downturn from the peak to trough to peak again.

As you can see the last downturn lasted 97 months (over 8 years) peak to peak including roughly 43 months of annual price declines during the heart of the downturn.

Notice that peak declines have been FAR more significant to date and, keeping in mind that our current run-up was many times more magnificent than the 80s-90s run-up, it is not inconceivable that current decline will run deeper and last longer.

Monday, October 29, 2007

Goin’ Down Slow: Survey of Consumers October 2007


The latest and historical results of the Reuters/University of Michigan Survey of Consumers provides a wealth of information for anyone looking to better understand how consumer sentiment has effected or has been effected by the housing bust.

Let’s face it, something significant must have changed in the minds of consumers between the spring and fall of 2005 that led the unwinding we see today.

With the historically low interest rates, solid employment, the loose lending situation and all the news and media coverage of the “flipping” mania, the times couldn’t have been better for home buying if ease of qualification and expectations of near term appreciation were to be the deciding factors.

But yet, something major did change and well in advance of the actual economic pullback or turmoil we are seeing now.

As I believe we will see more clearly in years to come, the housing boom was simply a classic, though enormous, asset bubble fueled primarily by the unprecedented availability of cheap money combined with the totally human response of popular delusion.

The following charts (click for huge versions) show the result of the Survey of Consumers and some components that are specifically related to housing.

The first chart shows the Consumer Sentiment Index, Index of Consumer Expectations, and the Current Economic Conditions Index from 2000 to the present.

The next five charts shows key housing related components of the Consumer Sentiment Index divided between “Good Time to Buy a Home” and “Bad Time to Buy a Home” plotted against the S&P/Case-Shiller Composite Index (CSI) from 1987 to March 2007, the latest historical data available.

I will provide some more thorough analysis in a later post but for now a cursory look at the housing related charts seems to reveal some fairly interesting insight into how consumers interpreted basic aspects of the housing situation throughout the run-up and now the decline.


Friday, October 26, 2007

Housing Decline Spillin’ Over on Consumers!


Ouch!

Today, the latest release of the Reuters/University of Michigan Survey of Consumers showed in unequivocal terms that the US consumer is feeling the burn from declining home values.

In fact, 28% of respondents reported that their own homes had declined in value, well above the record peak result of 24% recorded during the last housing slump in 1992.

Furthermore, the Index of Consumer Sentiment fell 13.56% as compared to October 2006 mostly as a result of consumers’ expectations of future economic prospects.

The Index of Consumer Expectations (a component of the Index of Leading Economic Indicators) fell a whopping 17.33% below the result seen in October 2006 with 22% of respondents anticipating further declines to their homes value.

As for the current circumstances, the Current Economic Conditions Index fell 9.04% as compared to the result seen in October 2006.

Interestingly, the survey reported that the most respondents in 50 years perceived BOTH a high availability of discounted homes AND unfavorable home selling conditions.

BNN MUST SEE TV! – Greenspan on Comedy Central, Ron Paul, Zandi, Shiller, Farber and Realtor’s Lampooned!


There were a lot of revealing and informative video segments this week (and last) covering topics related to the housing-mortgage-credit turmoil, the outlook for the consumer and prospects for recession.

Better yet, Realtor’s are now being lampooned in a whole raft of comedic segments on You Tube… I just love the information era!

First, there was an interesting Greenspan appearance on The Daily Show where he suggests that the Fed acts as regulation on the “free” market and that although monetary policy is intended to keep prices stable, lowering interest rates can cause asset and general inflation.

Watch Greenspan Comes Clean on BNN!

Next up is a great Diana Olick segment covering the truly awful state of housing and general recession occurring in Michigan.

Detroit home prices are down 32% with 1 foreclosure for every 29 homes. There has been a local subprime implosion and a recent auction saw homes being sold for the price of a new sofa! Could this be a harbinger of things to come?

Watch into the Future on BNN!

Next, Ron Paul deftly outlines his view of our monetary system, the devaluing of the US dollar, the expense of financing the war and its impact and implications for the poor, middle and upper class.

Watch Ron Paul Talk Economy on BNN!

Next, Mark Zandi, Chief Economist of Moody’s Economy.com joins Bloomberg to discuss the latest housing data showing foreclosure’s doubling in September as compared to 2006.

Zandi suggests that foreclosure will continue into 2009 with Alt-A and Jumbo loans now firmly joined in the fray. As Zandi sees it, states that Boston, Florida, Las Vegas etc… are “a complete mess”.

Watch Zandi Talk Turmoil on BNN!

Next, an excellent News Hour appearance by Professor Robert Shiller and Economist David Hale discussing the latest state of the housing market, it impact on the economy, and its outlook and the outlook for recession in the general economy.

Shiller points out that the recently announced CitiGroup, BofA and Chase rescue fund is reminiscent of past responses by banks during times of crisis (JP Morgan, etc.) and that, although it may help to restore confidence, it may also simply be one of the many events to occur during the unwinding.

Watch Shiller’s Cliffhanger on BNN!

Next, here is easily one of the best interviews I have ever seen concerning economics or otherwise.

Marc Faber, publisher of the Gloom, Boom and Doom Report seems to effortlessly and completely express virtually every aspect of cautious sentiment relating to our current economic predicaments. This interview is just over 30 minutes long but is thoroughly engrossing and well worth the investment.

Watch Farber’s Gloom, Boom and Doom on BNN!

Next, here is kind of a funny interview with Equifax CEO Richard Smith which, although uncomfortable, possibly discloses some interesting facets of the American credit-consumer.

Smith suggests that, although things are NOT getting any better in the credit markets, the majority of the sub-prime housing pain is “isolated” to seven states.

Furthermore, Smith states that lending practices are getting “far tighter” and that the number of mortgages being underwritten today is “far less” than just six months ago.

Watch Credit Squeeze the Consumer on BNN!

Finally, we have a comical short starring Brent Chapman that I think says it all concerning the true nature of the Realtor business. Things must be really going awry for the National Association of Realtors when everyday folks start taking comedic pot shots at ‘em!

Watch Realtors be Lampooned on BNN!

Thursday, October 25, 2007

New Home Sales: September 2007


Today, the U.S. Census Department released its monthly New Residential Home Sales Report for August that again confirmed the hideous falloff in demand for new residential homes both nationally and in every region as well as reporting significant downward revisions to June, July and Augusts’ results.

As with prior months, on a year-over-year basis sales are still declining significantly, with the national measure dropping a truly ugly 23.3% below the sales activity seen in September 2006.

It’s important to keep in mind that these declines are coming on the back of the significant declines seen in 2006 further indicating the significance of the housing bust.

The following charts show the extent of sales declines seen since 2006 as well as illustrating the further declines 2007 is showing on top of the 2006 results (click for larger versions)

Note that the last chart essentially combines the year-over-year changes seen in 2005 and 2006 and shows sales trending down precipitously as compared to the peak period.


Look at the following summary of today’s report:

National

  • The median price for a new home was up 4.98% as compared to September 2006.
  • New home sales were down 23.3% as compared to September 2006.
  • The inventory of new homes for sale declined 6.6% as compared to September 2006.
  • The number of months’ supply of the new homes has increased 22.1% as compared to September 2006.
Regional

  • In the Northeast, new home sales were down 8.1% as compared to September 2006.
  • In the West, new home sales were down 12.2% as compared to September 2006.
  • In the South, new home sales were down 28.9% as compared to September 2006.
  • In the Midwest, new home sales were down 28.3% as compared to September 2006.

Wednesday, October 24, 2007

Existing Home Sales Report: September 2007


Today, the National Association of Realtors (NAR) released their Existing Home Sales Report for September showing, perfectly clearly, that demand for residential real estate has now taken a new leg down uniformly across the nation’s housing markets likely as a direct result of the significant structural changes that have taken place in the credit-mortgage markets.

Within the release, Senior Economist Lawrence Yun now attempts to persuade readers that, although the changes in the mortgage market have been significant and are having an impact on sales, this is merely a temporary situation that is likely to resolve shortly.

“The good news is that mortgage availability has markedly improved in recent weeks with interest rates on jumbo loans falling, and more people are applying for safer and conforming FHA mortgage products. Some of the cancelled transactions will move forward as buyers apply for other loans.”

Additionally, NAR President Pat Vredevoogd Combs continues her absurd attempts to support her trade association by suggesting that if a buyer feels unsure about the conditions in the housing market, they should consult with a realtor.

“Because local conditions vary widely, it’s important for consumers to understand the fundamentals of what’s going on in their area. To sort through the factors in a particular neighborhood, both buyers and sellers should consult with a Realtor to help them navigate the current local market.”

Today’s report is truly stark and provides total confirmation that the nation’s housing markets have now taken a new leg down with EVERY region showing significant double digit declines to sales of BOTH single family and condos as well as large increases to inventory and an explosion in monthly supply as a result of the collapsing pace of sales.

Keep in mind that these declines are coming “on the back” of last year’s fairly dramatic declines further indicating that the housing markets are truly in the process of a tremendous correction.

Below is a chart consolidating all the year-over-year changes reported by NAR in their September 2007 report.

Particularly notable are the following:

  • Sales are down significantly in EVERY region and for BOTH single family and condo.
  • ALL Inventory and Months Supply show significant increases on a year-over-year basis.

Reading Rates: MBA Application Survey – October 24 2007


The Mortgage Bankers Association (MBA) publishes a weekly applications survey that covers roughly 50 percent of all residential mortgage originations and tracks the average interest rate for 30 year and 15 year fixed rate mortgages as well as application volume for both purchase and refinance applications.

The purchase application index has been highlighted as a particularly important data series as it very broadly captures the demand side of residential real estate for both new and existing home purchases.

The latest data is showing that the average rate for a 30 year fixed rate mortgage decreased since last week to 6.21% while the purchase volume decreased 3.1% and the refinance volume increased 4.0% compared to last weeks results.

It’s important to note that the data is reported (and charted) weekly and that the rate data represents average interest rates, and the index data represents mortgage loan application volume for home purchases, home refinances and a composite of all loans.

The following chart shows how the principle and interest cost and estimated annual income required to cover the PITI (using the 29% “rule of thumb”) on a $400,000 loan has changed since January 2007.

The following chart shows the average interest rate for 30 year and 15 year fixed rate mortgages over the last number of weeks (click for larger version).

The following charts show the Purchase Index, Refinance Index and Market Composite Index since January 2007 (click for larger versions).


Tuesday, October 23, 2007

Crashachusetts Existing Home Sales: September 2007

Yesterday, the Massachusetts Association of Realtors (MAR) released their Existing Home Sales Report for September 2007 showing a slight bump in the road for president Doug Azarian’s purported two month long winning streak of increasing home sales.

In fact, MAR reports that in September, single family home sales plummeted 13.7% as compared to September 2006 with a median price decline of 0.3%.

Along with MARs release, Azarian blames the media coverage of the mortgage-credit crisis for keeping buyers on the sidelines while he simultaneously attempts to goad potential buyers by invoking the “for credit-worthy buyers now is a really good time to buy” jargon.

“it is definitely possible that all the reports about foreclosures, lack of financing, and the like have taken their toll and the result is that buyers are waiting on the sidelines. However, despite the disappointing news, interest rates are still low and for credit-worthy buyers now is a really good time to buy.”

Although I just love the addition of “for credit-worthy buyers” to that tired old line, I can’t say the same for the quality of MARs numbers.

As usual, The Warren Group’s latest figures were significantly different than that of MARs showing single family home sales down 18.7% and a median price decline of 4.4% as compared to September of 2006.

Whereas last month I speculated that we were at a crossroads of perception and information, I believe with September’s results we have firmly crossed over to the new reality of virtually non-existent (or ridiculously costly and inaccessible… take your pick) Jumbo and No-Doc loans.

We are now clearly seeing the results of the credit-mortgage crisis on home sales resulting in a new leg down that is not likely to recover anytime soon.

I now feel firmly that the next few monthly results of the S&P/Case-Shiller index for Boston will show renewed price declines indicating that as the mortgage-credit crisis unwinds, out area is not immune.

To better illustrate the drop-off in home prices and the potential length and depth of the current housing decline, I have compared BOTH the year-over-year and peak percentage changes to the S&P/Case-Shiller home price index for Boston (BOXR) from the 80s-90s housing bust to today’s bust (ultra-hat tip to the great Massachusetts Housing Blog for the concept).


The “year-over-year” chart compares the percentage change, on a year-over-year basis, to the BOXR from the last positive value through the decline to the first positive value at the end of the decline.

In this way, this chart captures only the months that showed monthly “annual declines” and as we can see, if history is to be a guide, we could be about one third of the way through the annual price declines with the majority of falling prices yet to come.

The “peak” chart compares the percentage change, comparing monthly BOXR values to the peak value seen just prior to the first declining month all the way through the downturn and the full recovery of home prices.

In this way, this chart captures ALL months of the downturn from the peak to trough to peak again.

As you can see the last downturn lasted 105 months (almost 9 years) peak to peak including 34 months of annual price declines during the heart of the downturn.

Notice that peak declines have been more significant to date and, keeping in mind that our current run-up was many times more magnificent than the 80s-90s run-up, it is not inconceivable that current decline will run deeper and last longer.

As in months past, be on the lookout for the inflation adjusted charts produced by BostonBubble.com for an even more accurate "real" view of the current market trend.

September’s Key Statistics (according to MAR):

  • Single family sales declined 13.7% as compared to September 2006
  • Single family median price decreased 0.3% as compared to September 2006
  • Condo sales declined 13.0% as compared to September 2006
  • Condo median price increased 1.9% as compared to September 2006
  • The number of months supply of single family homes stands at 12.1 months.
  • The number of months supply of condos stands at 12.1 months.
  • The average “days on market” for single family homes stands at 129 days.
  • The average “days on market” for condos stands at 135 days.

Monday, October 22, 2007

The Daily 2¢ - Housing On the Block!

I wanted to make sure that everyone was aware of a number of truly huge home actions occurring around the country in the next few weeks.

These auctions will be carried out by The Real Estate Disposition Corporation (REDC) and will include four days of auctioning in southern California, two days in Massachusetts, one day in Huston, and one day in Phoenix.

All together, over 1100 single family, multi family, condo and townhomes will be auctioned likely at significantly reduced prices.

Before you get the idea that all these properties are junk, browse the (ever growing in number) listings.

With only a cursory glance, I was able to find one single family on Nantucket, a bunch, even new construction, in some reasonable locations on Cape Cod, and even a few located in the within the first tier of towns directly bordering Boston.

The starting bid on many of the homes range between $1000 to low $100K and all homes will be open for inspection walkthroughs on dates specified on the REDC website.

Keep in mind that just a few weeks ago a similar auction in Michigan took place with many bidders walking away with homes for a mere $2000.

The current owners (banks, Countrywide Financial (NYSE:CFC), Wall Street, whomever) have struck out selling these homes on the normal markets and are now simply attempting the cut them loose and take their losses.

I think this is not only an obvious symptom of how bad things really are in the nation’s housing markets but I believe it is also a real harbinger of things to come and may simply be an opening salvo in the much larger production as the economy likely drifts ever closer to recession.

Friday, October 19, 2007

The Daily 2¢ - Nouvelle Bulle


At the risk of sounding too blunt and negative I have to revisit the condo development at the Natick Mall in Natick Massachusetts as this condo development is apparently gaining more national attention and has now been covered in a recent New York Times article.

For those of you who hadn’t read my prior post on the project, the “Nouvelle at Natick” is a luxury condo building built right up against, and in fact actually attached to, the old Natick Mall… now revamped and renamed the “Natick Collection”.

In my last post I opined at great length about the truly odd circumstances of the “luxury” condo complex with its 215 units ranging in asking price from $439,900 for a one bedroom to $1,599,900 for a 2190 square foot “penthouse” and speculated that its mere existence may physically embody the sheer lunacy that came about from the Great Housing Bubble.

Now, it appears that I may not be alone in thinking that paying huge bucks for the privilege of living in a mall is unappealing.

According to the article, to date only 15% of the 215 units have actually gone under contract.

Furthermore, many of the current buyers signed those contracts as far back as the spring of 2005 so I would think that this is a clear indication that these units are not going anywhere, anytime soon.

Keep in mind that Boston’s luxury condo projects have been taking a serious beating these days with developments like the Harborview, built right on the Charlestown Navy Yard, going into foreclosure because they failed to sell any units … that’s the WHOLE BUILDING in foreclosure not individual units.

You have to wonder, if a builder can’t sell a luxury condo right on the water within Boston proper, how in the world are they going to move units that are attached to a suburban mall some 20 miles out of town.

How could the developer, General Growth Properties (NYSE:GGP) have gotten it so wrong?

What’s worse is that GGP paid huge sums of money and agreed to substantial affordable housing effort just to be allowed to do the project in the first place.

It’s been reported that not only did GGP pay the neighboring town of Framingham $1 million for renovations of highway and transportation facilities but they agreed to supply the wider community with 48 affordable housing units.

Now, before you get the idea that these affordable units are located somewhere within the “luxury” complex, think again.

Nothing could be farther from the truth.

It appears that GGP has purchased random condo, multi-family and single family housing units from around Natick with plans to sell them to qualified low income buyers at greatly reduced cost.

These sales will take place during December and January and will be carried out through the use of a common lottery system where winners get the opportunity to buy the low cost units.

Doesn’t this all sound a bit crazy?

Anyhow I’ll keep posting as future developments occur but for now, here is a promotional video clip about the “Nouvelle”… it should be worth a good watch!


Thursday, October 18, 2007

The Arlington Artifice: September 2007


This post will be the first in a series recurring monthly that will track the latest results of the housing market seen in Arlington Massachusetts.

I’m choosing Arlington as a result of the Boston Globe’s recently published and absurdly anecdotal and ludicrous farce about the town’s “hot” housing market.

The ridiculous tone and outright mishandling of the housing data by the Boston Globe “reporter” would almost be comical if it weren’t for the fact that the Globe’s editor, Martin Baron, ALSO blundered seriously when he responded to my email about the discrepancies.

Baron attempted to justify the articles contents and in so doing, he disclosed his poor and obviously unsophisticated abilities with even most basic economic data.

I will add that I believe that this particular episode is truly representative of both the effects that advertisement has on a major media sources’ editorial process as well as the effect that its farcical result has on the public.

To that end, any of you Bostonians with stories of unaware citizens blindly recounting the details of that article please leave the details below in the comments section.

September’s raw results (as reported by The Warren Group) show us the following for Arlington:

  • September median home sales price of $464,500, the lowest value since 2003.
  • Year-to-Date median home sales price of $467,500, the lowest value since 2003.
  • September home sales count of 18, the lowest value on record since 1988 tying the result seen in September of 1992.
  • Year-to-Date home sales count of 270, a result on par with 2006 and 2005.
As I showed in my prior post, this data when charted and compared to other towns in the region proves there are absolutely no grounds to call Arlington’s market exceptional.

The following chart (click for much larger version) shows how Arlington’s median sales price has changed since 1988, the first year the data was tracked by the Warren Group.

Notice that while the current monthly result is clearly the most jagged and volatile measure, all three (monthly, year-to-date, and annual) measures are essentially saying the same thing, namely median prices are going down.

The next chart (click for much larger version) shows that home sales in Arlington have been essentially flat during the last 15 years, a result that is generally to be expected when looking only at the sales of one town in isolation.

The final chart shows how the year-to-date median sales price for Arlington, Bedford, Belmont, Cambridge and Lexington has changed since 1988.

Notice that each town is essentially staying on the same track having made great strides during the boom and now firmly headed lower.

In review, the data shows that there is nothing exceptional about Arlington’s housing market proving clearly that the claims made in the Boston Globe article and later endorsed by its editor Martin Baron were entirely erroneous.

Please let editor Baron know what you think of this misstep.

Wednesday, October 17, 2007

New Residential Construction Report: September 2007

Today’s New Residential Construction Report firmly indicates a new leg down in the decline to the nation’s housing markets and for residential construction showing substantial declines on a year-over-year and month-to-month basis to single family permits both nationally and across every region.

Single family housing permits, the reports most leading of indicators, again suggests extensive weakness in future construction activity dropping 28.6% nationally as compared to September 2006.

Moreover, every region showed high double digit declines to permits with the West declining 34.6%, the South declining 30.4%, the Midwest declining 19.3% and the Northeast declining 16.0%.

Keep in mind that these declines are coming on the back of last year’s record declines.

To illustrate the extent to which permits and starts have declined, I have created the following charts (click for larger versions) that show the percentage changes of the current values compared to the peak years of 2004 and 2005.

Notice that on each chart the line is essentially combining the year-over-year changes seen in 2005 and 2006 and shows virtually every measure trending down precipitously.

Although year-over-year declines to permits, for example, have not accelerated measurably from September 2006, the fact that they continue to decline roughly 20%-30% should provide a solid indication that they are by no means stabilizing.


Remember that permits, starts, and completions are not simply independent measures but are, in fact, three logically related and dependent measures.
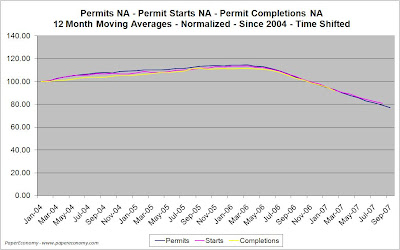
In the process of a building project, first you get the “permit”, next you “start” building, and finally you “complete” the project.

For this reason, one must adjust expectations prior to reading a newly released Census Department report to account for the true nature of the data published simultaneously each month.

As in past months, I have “smoothed” out the unadjusted data and aligned the three data series (i.e. moved starts ahead a month and completions ahead six months) to make more obvious their trend.


Here are the statistics outlined in today’s report:

Housing Permits

Nationally

  • Single family housing permits down 28.6% as compared to September 2006
Regionally

  • For the Northeast, single family housing down 16.0% as compared to September 2006.
  • For the West, single family housing permits down 34.6% as compared to September 2006.
  • For the Midwest, single family housing permits down 19.3% as compared to September 2006.
  • For the South, single family housing permits down 30.4% compared to September 2006.
Housing Starts

Nationally

  • Single family housing starts down 30.8% as compared to September 2006.
Regionally

  • For the Northeast, single family housing starts down 20.0% as compared to September 2006.
  • For the West, single family housing starts down 32.2% as compared to September 2006.
  • For the Midwest, single family housing starts down 28.8% as compared to September 2006.
  • For the South, single family housing starts down 32.4% as compared to September 2006.
Housing Completions

Nationally

  • Single family housing completions down 30.8% as compared to September 2006.
Regionally

  • For the Northeast, single family housing completions down 20.0% as compared to September 2006.
  • For the West, single family housing completions down 32.2% as compared to September 2006.
  • For the Midwest, single family housing completions down 28.0% as compared to September 2006.
  • For the South, single family housing completions down 32.4% as compared to September 2006.
Keep in mind that this particular report does NOT factor in the cancellations that have been widely reported to be occurring in new construction.