Monday, July 30, 2007

A Closer Look at New Home Sales

As I had noted before, in 2004 new home sales exhibited an interesting phenomena whereby the distribution of home sales, grouped by several price ranges, effectively flipped from what one might conclude to be logical and from the historical norm.

Prior to 2004, in general, the least expensive new homes sold the most numbers of units while the most expensive new homes sold the least numbers of units.

Not a very surprising result as one might easily conclude that the majority of new home buyers cannot, in general, afford the most expensive homes.

After 2004 though, the scenario exactly flipped in that the most expensive new homes easily outsold the least expensive homes.

Now, this could either be explained by the inflating of home prices during the boom, easy availability of bloated loans, home buying patterns, or a little bit of all of these events but no matter what the cause, it appears that the scenario is now in the process of flipping yet again.

Since the peak in 2005 new home sales have been falling among all price ranges but more recently there have been relative strength in the sales of lower priced home and a marked weakness in sales of the highest priced homes.

The interesting point here is that the “flip” that occurred in 2004 was likely an anomaly made possible by the boom which is likely to completely reverse in the coming years as the environment for home building settles back to a more historically normal scenario.

This “re-flipping” of new home sales may serve as a good indicator of the unwinding of the boom.

The first chart shows new home sales for the highest priced new homes, i.e. homes priced above $300,000 (click for larger version). Notice that since 2005 sales have been declining sharply.

The following chart shows the unadjusted number of new homes sold for four different price ranges (click for larger). Notice that the price ranges appear to be converging and likely flipping back to a more historical normal pattern.

Another way to visualize this issue is to view each price ranges “market share” of all new homes sold (click for larger version). Notice that back in 1999, over 40% of new homes were priced under $200,000 whereas now, new home sales for homes in this price range total less than 20%.

Friday, July 27, 2007

GDP Report: Q2 2007 Advance


Today, the Bureau of Economic Analysis (BEA) released their first installment of the Q2 2007 GDP Report showing higher than expected growth of 3.4%, buoyed by strength in nonresidential structures and federal, state and local government spending while continuing to be weighed down by weakness to fixed residential investment.

It’s important to keep in mind that today’s results are very preliminary and will not be finalized for another two installments.

Additionally, today’s report reflected a revision to the national income and product accounts (NIPAs) which resulted in revisions to virtually every estimate since 2004.

As a result of the NIPA revision, previously reported estimates of residential fixed investment were generally revised lower resulting in an even greater impact on the GDP results seen in 2006 and 2007.

Residential fixed investment, that is, all investment made to construct or improve new and existing residential structures including multi–family units, continued its historic fall-off registering a decline of 9.3% since last quarter while shaving .49% from overall GDP.

Housing continues to be, by far, the most substantial single drag on GDP subtracting an amount roughly equivalent to the contributions made by all exports during the quarter.

The following chart shows real residential and non-residential fixed investment versus overall GDP since Q1 2003 (click for larger version).

Thursday, July 26, 2007

New Home Sales: June 2007


Today, the U.S. Census Department released its monthly New Residential Home Sales Report for June showing renewed declines, even accelerating in some regions, as well as significant downward revisions to last month’s results.

As with prior months, on a year-over-year basis sales are still declining in the double digits at 22.27% below the sales activity seen in June 2006.

It’s important to keep in mind that these declines are coming on the back of the significant declines seen in 2006 further indicating that the decline is not abating.

This should not be understated as it is clearly showing continued and even accelerating weakness to new home sales.

The following charts show the extent of sales declines seen since 2006 as well as illustrating the further declines 2007 is showing on top of the 2006 results (click for larger versions)

Note that the last chart essentially combines the year-over-year changes seen in 2005 and 2006 and shows sales trending down precipitously as compared to the peak period.


Look at the following summary of today’s report:

National

  • The median price for a new home was down 2.17% as compared to June 2006.
  • New home sales were down 22.3% as compared to June 2006.
  • The inventory of new homes for sale declined 5.0% as compared to June 2006.
  • The number of months’ supply of the new homes has increased 21.9% as compared to June 2006.
Regional

  • In the Northeast, new home sales were up unchanged as compared to June 2006.
  • In the West, new home sales were down 42.8% as compared to June 2006.
  • In the South, new home sales were down 12.9% as compared to June 2006.
  • In the Midwest, new home sales were down 28.4% as compared to June 2006.

Wednesday, July 25, 2007

Existing Home Sales Report: June 2007

Today, the National Association of Realtors (NAR) released their Existing Home Sales Report for June showing that an increasing fall-off in demand for residential real estate is occurring uniformly across the nation’s housing markets.

Senior Economist Lawrence Yun is now suggesting that the weakness is mostly as a result of the increasing interest rates, tightening lending standards and home buyers getting mixed signals about the state of the market.

“Home buyers have been getting mixed signals about the housing market, which is causing some of them to hesitate, … Mortgage interest rates have risen recently, and tightening lending standards are continuing to hamper sales, but fewer risky loans will put the market on a healthier path. Although general buying conditions remain favorable for long-term home buyers, it appears some buyers are looking for more signs of stability before they have enough confidence to make an offer.”

Additionally, NAR President Pat Vredevoogd Combs continues to attempt to persuade potential buyers to ignore the obvious dramatic housing correction.

“Consumers should avoid making decisions based on what they hear about the national market because all real estate is local, … There are pockets around the country where home sales are quite strong, so you really need to consult with a knowledgeable real estate professional about local market conditions – experience is one way Realtors® add value to the real estate transaction, and a reputable agent is your best resource to navigate the current market, whether it’s moving up or down,”

Looking at June’s Existing Home Sales report should only result in additional confirmation that the nation’s housing markets are continuing to experience weakness with EVERY regions showing considerable declines to sales as well as continued increases to inventory and monthly supply.

It’s important to note that June is traditionally the best month for sales so although we are seeing significant weakness to sales as compared to last year’s results, the greater number of sales in this peak months results are likely disproportionately impacting both inventory and “months of supply”, making them appear to be decelerating.

Sales are essentially all down here from now for the remainder of 2007 and both inventory and “months of supply” should resume the bloating with every remaining month.

Keep in mind that we are now seeing existing home sales declines on the back of last years fairly dramatic declines further indicating that the housing markets are not bottoming as many had been suggested last fall.

Below is a chart consolidating all the year-over-year changes reported by NAR in their June 2007 report.

Particularly notable are the following:

  • ALL sales are down with the worst coming from the West where sales were down in the high double digits for all product types.
  • ALL Inventory and Months Supply show significant increases on a year-over-year basis.

Reading Rates: MBA Application Survey - July 25 2007


The Mortgage Bankers Association (MBA) publishes a weekly applications survey that covers roughly 50 percent of all residential mortgage originations and tracks the average interest rate for 30 year and 15 year fixed rate mortgages as well as application volume for both purchase and refinance applications.

The purchase application index has been highlighted as a particularly important data series as it very broadly captures the demand side of residential real estate for both new and existing home purchases.

The latest data is showing that the average rate for a 30 year fixed rate mortgage declined marginally since last week and now stands at the near peak for the year at 6.59% while the purchase volume decreased 5.0% and the refinance volume decreased 1.4% compared to last weeks results.

It’s important to note that the data is reported (and charted) weekly and that the rate data represents average interest rates, and the index data represents mortgage loan application volume for home purchases, home refinances and a composite of all loans.

The following chart shows how the principle and interest cost and estimated annual income required to cover the PITI (using the 29% “rule of thumb”) on a $400,000 loan has changed since January 2007.

The following chart shows the average interest rate for 30 year and 15 year fixed rate mortgages over the last number of weeks (click for larger version).

The following charts show the Purchase Index, Refinance Index and Market Composite Index since January 2007 (click for larger versions).


Mozilo’s Perfect Storm


Countrywide Financial (NYSE:CFC) yesterday hosted their Q2 2007 earnings conference call in which there was an extended Q&A session with top executives, particularly CEO Angelo Mozilo, on topics ranging from the outlook for housing and the Fed’s new lending standards to the recent degeneration of prime HELOC loans.

The following is a selection of some of the more revealing responses from CEO Angelo Mozilo.

When asked what signs he is looking for to indicate an end to the pain in the housing decline, Mozilo cites the inventory overhang and then makes a pretty feeble argument that nobody saw the train wreck coming while simultaneously pointing fingers at the ratings agencies and other financial institutions.

“I think the first thing is that the inventory of the house supply has to reverse itself. As I view it, and I have been through a lot of these things in fifty four years, although the market is a lot bigger now so the problems are a lot bigger.

But as I try to walk through what happened here, and could a lot of this have been foreseen and you tend to try to reflect on your own activities and should we have known, we have seen it.

But as I do reflect on it, and I do a lot, nobody saw this coming.

S&P and Moody’s didn’t see it coming, but they simply just downgrade bonds. Bear Stearns certainly didn’t see it coming, Merrill Lynch didn’t see it coming, nobody saw this coming.”

Then Mozilo attempts to pass the blame to the Fed, suggesting that their raising of interest rates had a major impact on the housing market.

“The Fed, knowing that well over 50%, 60%, 70% of the loans made in 2003, 2004, 2005 and 2006 were indexed variable rate loans, indexed one way or another to the Fed funds rate, increased the Fed funds rate seventeen times… seventeen consecutive times with most of the product out there being variable rate product.

You never knew when they were going to stop increasing.

The fact that they did that had a material impact on affordability as people went to refinance or people went to buy… Major major impact. ”

When asked about the performance in the prime market Mozilo suggests that the dramatic increase in prime delinquencies is currently due to life events and not rate resets further suggesting that it is an ongoing process.

“So far what we have seen in delinquencies to a great extent are not resets at all but people losing their jobs, loss of marriage, loss of health and the problem is that they either can’t refinance because the value of their homes have gone down, so their under water, or the program that they used to get into the home is no longer available to them. So right now the delinquencies are being driven by more traditional issues then they are about concern about resets.”

“I do think it’s important to observe what happens going forward because we are experiencing home price depreciation almost like never before with the exception of the Great Depression and so I think using standards or frames of reference on prime and the performance of prime in other environments may not be a fair comparison in light of what’s happening to real estate values.”

When asked that, with the benefit of hindsight, what could have been done differently, Mozilo seems to suggest that the lending mania was a function of the markets supply and demand and that Countrywide was compelled to join in the craze else risk becoming nonexistent.

“The obvious answer is that the deterioration in house values, if we knew that, we would have had to really stop doing that business and the company would have been a very different company because you can’t do this absent competition. Our volumes, our whole place in the industry would have changed dramatically because we would have arbitrarily made a decision that was contrary to what everything appeared to be. Values going up, no delinquencies, no foreclosures, and we suddenly stop the music, and say that we’re not going to participate in home equity loans, in subprime, in high LTVs, no-docs and that sort of thing. It would have been an insight that only a superior spirit could have had at the time.

I ask myself that all the time as CEO… what should I have known and when should I have known it and what should I have done about it.

As I go through that process, it’s obvious that if we had stopped participating in those major areas of the business, we just couldn’t stop it there, it would have affected us through the entire spectrum of our lending operations because you can’t say ‘we’re out of subprime we only want prime’ because the providers of loans provide both subprime and prime both and will not give you the prime if you’re not willing to take the subprime.”

Later, talking more about the spillover of defaults into the prime market Mozilo suggests that PRIME HELOCs are the new subprime.

“The spillover into prime I don’t think is something that should shock anybody once you understand the definition of prime.

The basic issue you see today, particularly with Countrywide is the spillover into the HELOC portfolio.

At least for this quarter, it’s not really a subprime story, it’s a HELOC story and the deterioration in the piggy backs that were originated in order to assist the mortgagor to avoid PMI and all the advantages that that avoidance provided for the borrower.”

Finally, when discussing the recent Fed lending guidelines and their impact on the mortgage and housing markets, Mozilo that we are seeing the makings of the “perfect storm”.

The bottom line is, as values decrease, the options for borrowers, homebuyers, the combination of limiting their product available to them is exacerbating the problem.

The fact that the Fed joint agency guidelines seriously restricted liquidity for borrowers to either refinance or for people to buy homes… I’m not making a judgment whether it was right, wrong, or indifferent it’s just that that’s what it did.

And then combined with a volatile secondary market… you know if you think about the perfect storm, that’s the perfect storm. ”

The entire conference call can be listened to here.

Tuesday, July 24, 2007

Countrywide Fiasco!


I just hate to gloat about today’s stock plunge…

Well maybe not seeing that Countrywide Financial (NYSE:CFC) worked so tirelessly for so many years to either get people hooked on toxic loans or to consolidate their current and future traditional short term debt into their homes imaginary equity.

During the run-up years, Countrywide offered every product imaginable; subprime ARMS, no-doc, 80/20 zero down, interest only, 1 year out of bankruptcy, the list goes on and on.

All this done simply to bloat, some would say artificially, the bottom line.

Now, the chickens have come home to roost and Countrywide is due for an exuberant pecking.

Send in the impairment charges! Stock up for the loan losses!

In their latest quarterly earnings release for Q2 2007, Countrywide reported impairment charges of $417 million with $388 million coming from residual securities collateralized by PRIME home loans.

These losses were attributable to “accelerated increases in delinquency levels and increases in the estimates of future defaults and loss severities on the underlying loans.”

Additionally, Countrywide had to set aside $293 million for “held for investment” loan losses with $181 million of that related to PRIME loan losses.

The mania is over and now Countrywide will spend many years digging out from under the burdensome losses.

Crashachusetts Existing Home Sales: June 2007

Yesterday, the Massachusetts Association of Realtors (MAR) released their Existing Home Sales Report for June 2007 showing continued declines in demand in the regions residential housing market with the sales of single family homes dropping 6.0% compared to June of 2006.

Along with the release, MAR President Doug Azarian continued to spin his optimistic tale of price stabilization and inventory balance even in the face of renewed sales declines.

“While the second quarter wasn’t able to sustain the momentum of the first quarter compared to the year before, it was still very active … Looking at year-to-date numbers, we are not far off last year in terms of sales and median prices, while inventory and months of supply continue to go down. With only 7.5 months of supply, the residential market is now in ‘balance’. This is typically a good time for both buyers and sellers to come together.”

Azarian forgets to mention though that not only are inventories back on rise with the number of single family homes on the market increasing 1.7% since just last month, June is historically the region’s best month for sales effectively skewing the “months of supply” in favor of an unusually optimistic result.

Not that a little “smoke and mirrors” is all that out of the ordinary for MAR but let’s take a closer look to see how accurate it was for Azarian to call the market “balanced”.

First, the “months of supply” figure is calculated simply by dividing the total current inventory by the current month’s sales result.

For June, MAR reported a current inventory of 37,498 single family homes and 4,959 single family home sales resulting in 7.56 “months of supply”, a significant decrease from the 9.5 “month of supply” seen just this May.

But inventories have actually increased since May and June’s single family home sales were weak falling 6.0% below the results seen last year, so how could the “months of supply” have declined so dramatically?

Take a look at the chart below and it’s easy to see that June is by far the most active sales month for the year typically registering substantially more sales than the average month. (click for larger version).

This makes the June sales result NOT the best choice for calculating a truly accurate “months of supply” as it represents an anomaly in sales with respect to the rest of the year.

Possibly a better choice would have been to simply average the monthly sales results seen in to date in 2007 and use that as the denominator.

This would yield an average of 3462 single family home sales per month resulting in a likely more accurate 10.8 “months of supply” of single family homes.

Also note that as seen in the chart above, home sales are continuing to weaken with 2007 results generally coming in below 2006 which were generally below the results seen in 2005.

As for home prices, MAR reports a decline of 1.6% to the median price for a single family home as compared to June 2006 while the Warren Group again reported a more significant drop of 4.6%.

As with last month, the Warren Group’s results are more consistent with the latest results of the S&P/Case-Shiller home price index for Boston and likely far more accurate than the MAR’s MLS-listed only result.

With significantly falling prices, continued declining sales volume and a slowing pace of sales, it seems hard to believe that Azarian’s “market balance” call and optimistic outlook has any merit especially when considering that all of this weakness is coming on the back of the historic declines seen in 2006.

A more likely scenario is that our area is experiencing a fundamental correction to prices that, through unusually low interest rates and historically easy lending standards, were able to rocket to irrational heights during the run-up years.

To better illustrate the drop-off in home prices and the potential length and depth of the current housing decline, I have compared BOTH the year-over-year and peak percentage changes to the S&P/Case-Shiller home price index for Boston (BOXR) from the 80s-90s housing bust to today’s bust (ultra-hat tip to the great Massachusetts Housing Blog for the concept).


The “year-over-year” chart compares the percentage change, on a year-over-year basis, to the BOXR from the last positive value through the decline to the first positive value at the end of the decline.

In this way, this chart captures only the months that showed monthly “annual declines” and as we can see, if history is to be a guide, we could be about one third of the way through the annual price declines with the majority of falling prices yet to come.

The “peak” chart compares the percentage change, comparing monthly BOXR values to the peak value seen just prior to the first declining month all the way through the downturn and the full recovery of home prices.

In this way, this chart captures ALL months of the downturn from the peak to trough to peak again.

As you can see the last downturn lasted 105 months (almost 9 years) peak to peak including 34 months of annual price declines during the heart of the downturn.

Notice that peak declines have been more significant to date and, keeping in mind that our current run-up was many times more magnificent than the 80s-90s run-up, it is not inconceivable that current decline will run deeper and last longer.

As in months past, be on the lookout for the inflation adjusted charts produced by BostonBubble.com for an even more accurate "real" view of the current market trend.

June’s Key Statistics:

  • Single family sales declined 6.0% as compared to June 2006
  • Single family median price declined 1.6% as compared to June 2006
  • Condo sales declined 3.6% as compared to June 2006
  • Condo median price increased 4.4% as compared to June 2006
  • The number of months supply of single family homes stands at 7.6 months.
  • The number of months supply of condos stands at 7.2 months.
  • The average “days on market” for single family homes stands at 126 days.
  • The average “days on market” for condos stands at 124 days.

Friday, July 20, 2007

BNN - MUST SEE TV!

This was another busy week for the national housing decline where worries about subslime spillover, further indications by the Fed that they underestimated the severity of the housing decline, plunging housing permits, and an outright depression in homebuilder sentiment all worked to finally solidify the fact that housing collapse is nowhere near the bottom.

First up, Ron Napier, Head of Napier Investment Advisors joins CNBC in an excellent interview whereby he discusses his outlook for the US economy, and in particular the subprime mortgage and housing meltdowns and its spillover effects on the US consumer.

Napier points out that the Feds public message of containment is doublespeak and that the spillover on consumption is already occurring and can be plainly seen in the last few months of retail sales data.

Watch Napier’s excellent piece now on BNN!

Next up, Roger Nightingale, Economist with Millennium Global Investments joins CNBC to discuss his outlook for the US economy and the impact of the subprime mortgage meltdown.

Nightingale presents a decidedly pessimistic point of view pointing out that, measured in Euros or Pound Sterling, the latest stock market rally is really very weak and that it only looks spectacular through the prism of a dramatically weakening US Dollar.

Watch Nightingale sing now on BNN!

Next, David Wyss, Chief Economist with Standard & Poors, and Sean Egan, Managing Director of Egan-Jones Rating Company join CNBC to discuss the possibility of the market shaking off the subprime meltdown.

Wyss suggests that the meltdown is in the early stages and that S&P’s latest downgrades were based on subslime effects over the entirety of the next year while also pointing out that the housing decline will have to run its course before any bottom will be seen in the mortgage bust.

Leading to a slight skirmish between the two guests, Egan points out that the recent slew of downgrades to subprime securities is unusual and better ratings need to be in place before real visibility can occur.

Watch S&P dance now on BNN!

Next, ABX BBB index plummeting, flight to US Treasuries, Bear Stearns hedge funds worthless, Standard & Poors slashing ratings, more downgrades to come, as the Subslime continues to spread.

Watch the slime spread now on BNN!

Next, Doug Kass, President of Seabreeze Partners Management, discusses his outlook for the economy, and in particular the brokerage and hedge fund communities in the wake of the subprime meltdown.

Kass sees brokerage companies such as Goldman Sachs and the hedge fund communities as “the 21st century equivalent of the Wizard of Oz… sometimes deceitful, rarely magical and always immersed in leverage”.

Watch Kass talk Oz now on BNN!

Next, The Nightly Business Report takes a look at the truly depressed state of housing in Michigan.

With a slumping local economy and high unemployment, Michigan home prices have been falling substantially in recent months resulting in some of the nation’s highest rates of foreclosure.

Interestingly, Michigan may be a real harbinger of what is to come for the nation as a whole should the economy continue to weaken leading to recession.

Watch the future now on BNN!

Finally, an excellent and decidedly bearish special program produced by Bloomberg that seeks to shed additional light on the nature of the subprime meltdown and the outlook for the nation’s housing markets.

The program includes interesting interviews with Richard Syron, CEO and Chairman of Freddie Mac, Yale Economist Robert Shiller, Chriss Street, Treasurer of Orange County California, PIMCO’s Paul McCaulley, OFHEO’s Director James Lockhart, and private investors Marc Faber, Jim Rogers, and Ken Fisher.

Watch the “Wheels Come Off the Cart” now on BNN!

Wednesday, July 18, 2007

Reading Rates: MBA Application Survey - July 18 2007

The Mortgage Bankers Association (MBA) publishes a weekly applications survey that covers roughly 50 percent of all residential mortgage originations and tracks the average interest rate for 30 year and 15 year fixed rate mortgages as well as application volume for both purchase and refinance applications.

The purchase application index has been highlighted as a particularly important data series as it very broadly captures the demand side of residential real estate for both new and existing home purchases.

The latest data is showing that the average rate for a 30 year fixed rate mortgage declined since last week and now stands at the near peak for the year at 6.61% while the purchase volume decreased 1.6% and the refinance volume increased 4.9% compared to last weeks results.

It’s important to note that the data is reported (and charted) weekly and that the rate data represents average interest rates, and the index data represents mortgage loan application volume for home purchases, home refinances and a composite of all loans.

The following chart shows how the principle and interest cost and estimated annual income required to cover the PITI (using the 29% “rule of thumb”) on a $400,000 loan has changed since January 2007.

The following chart shows the average interest rate for 30 year and 15 year fixed rate mortgages over the last number of weeks (click for larger version).

The following charts show the Purchase Index, Refinance Index and Market Composite Index since January 2007 (click for larger versions).


New Residential Construction Report: June 2007

Today’s New Residential Construction Report continues to indicate significant weakness in the nations housing markets and for residential construction showing substantial declines on a year-over-year basis to single family permits both nationally and across every region.

Single family housing permits, the reports most leading of indicators, again suggests extensive weakness in future construction activity dropping 27.5% nationally as compared to June 2006.

Moreover, every region showed high double digit declines to permits with the West declining 30.7%, the South declining 30.3%, the Midwest declining 18.1% and the Northeast declining 14.9%.

Keep in mind that these declines are coming on the back of last year’s record declines.

To illustrate the extent to which permits and starts have declined, I have created the following charts (click for larger versions) that show the percentage changes of the current values compared to the peak years of 2004 and 2005.

Notice that on each chart the line is essentially combining the year-over-year changes seen in 2005 and 2006 and shows virtually every measure trending down precipitously.

Although year-over-year declines to permits, for example, have not accelerated measurably from September 2006, the fact that they continue to decline roughly 30% should provide a solid indication that they are by no means stabilizing.


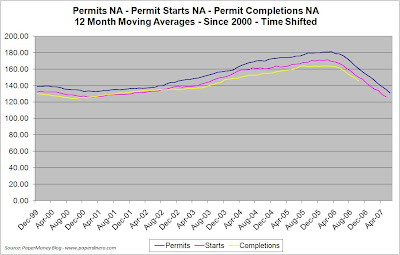
Remember that permits, starts, and competitions are not simply independent measures but are, in fact, three logically related and dependent measures.

In the process of a building project, first you get the “permit”, next you “start” building, and finally you “complete” the project.

For this reason, one must adjust expectations prior to reading a newly released Census Department report to account for the true nature of the data published simultaneously each month.

As in past months, I have “smoothed” out the unadjusted data and aligned the three data series (i.e. moved starts ahead a month and completions ahead six months) to make more obvious their trend.

The following is the unadjusted permits, permit-starts and permit-completion data charted since 2000 (click for larger version).

The following is the unadjusted permits, permit-starts and permit-completion data smoothed with a 12 month moving average (click for larger version).

The following is the smoothed data aligned to indicate the dependent nature of each series and showing the obvious leading nature of permits (click for larger version).

The following is the aligned data normalized to make the relationship even more obvious.


Here are the statistics outlined in today’s report:

Housing Permits

Nationally

  • Single family housing permits down 4.1% from May, down 27.5% as compared to June 2006
Regionally

  • For the Northeast, single family housing down 1.1% from May, down 14.9% as compared to June 2006.
  • For the West, single family housing permits down 1.9% from May, down 30.7% as compared to June 2006.
  • For the Midwest, single family housing permits down 3.4% from May, down 18.1% as compared to June 2006.
  • For the South, single family housing permits down 5.9% from May, down 30.3% compared to June 2006.
Housing Starts

Nationally

  • Single family housing starts down 0.2% from May, down 21.6% as compared to June 2006.
Regionally

  • For the Northeast, single family housing starts up 0.9% from May, up 19.6% as compared to June 2006.
  • For the West, single family housing starts up 6.7% from May, down 20.3% as compared to June 2006.
  • For the Midwest, single family housing starts up 3.1% from May, down 21.7% as compared to June 2006.
  • For the South, single family housing starts down 4.6% from May, down 27.2% as compared to June 2006.
Housing Completions

Nationally

  • Single family housing completions down 6.3% from May, down 29.8% as compared to June 2006.
Regionally

  • For the Northeast, single family housing completions up 11.4% from May, down 16.4% as compared to June 2006.
  • For the West, single family housing completions down 12.0% from May, down 38.3% as compared to June 2006.
  • For the Midwest, single family housing completions up 0.5% from May, down 35.6% as compared to June 2006.
  • For the South, single family housing completions down 8.4% from May, down 25.3% as compared to June 2006.
Keep in mind that this particular report does NOT factor in the cancellations that have been widely reported to be occurring in new construction.

Tuesday, July 17, 2007

Homebuilder Blues: NAHB/Wells Fargo Home Builder Ratings July 2007

Today, the National Association of Home Builders (NAHB) released their Housing Market Index (HMI) showing additional evidence that the new home market is experiencing a new leg down in declines.

Measuring builder confidence across six key data points, the builder survey has been a bellwether for the new home market since 1985.

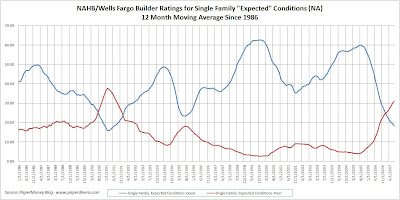
The component measures used to formulate the overall HMI are respondent ratings on “present conditions”, “future conditions” and “buyer traffic” all of which continue to indicating significant current and future weakness as the new home market slumps its way slowly forward, now long separated from an exceptionally disappointing spring selling season.

In fact, July’s “present”, “future” and “buyer traffic” condition results have moved to the worst levels seen since early 1991 when the nation’s housing market was slumping through its last major housing bust.

The following charts show “present conditions”, “future conditions” and “buyer traffic” both smoothed since 1986 and unadjusted since 2005 (click for larger versions).

Keep in mind that for each measure respondents are asked to assign both a “good” and “poor” rating so in each chart you will notice “good” slumping while “poor” is surging.


Countrywide Foreclosure

Yesterday, Countrywide Financial (NYSE:CFC) announced that their foreclosure situation was worsening and investors reacted by dumping the stock to the tune of nearly 4%.

At the heart of the matter was Countrywide’s relatively new disclosure that, as a percentage of all unpaid principle, foreclosures had soared, increasing over 113% since last year and standing now at just under 1% of all outstanding principle.

Prior to January 2007, Countrywide reported foreclosure data as a percentage of the total number of loans serviced which obviously lacked complete clarity.

Below, are charts of both measures; foreclosures by total number of loans serviced and foreclosures by percentage of unpaid loan principle (Click for larger versions).

Either way you slice it, Countrywide is looking at some significant increases in foreclosure activity but notice that for the “unpaid loan principle” method, things are really looking dire.

Be sure to check out the Countrywide Financial Foreclosures (REO) Blog’s Inventory Tracker for some more startling evidence that foreclosures are skyrocketing over at Countrywide Financial as well as some excellent REO tracking features.