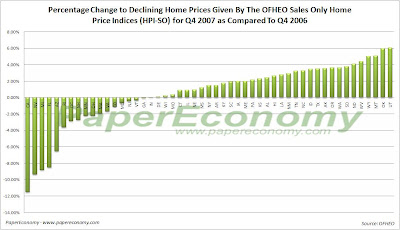
 Today, the Office of Federal Housing Enterprise Oversight (OFHEO) published their Home Price Index (HPI) data for Q4 2007 showing unprecedentedly widespread weakness with 49 states and Washington DC experiencing peak home price declines with 20 declining better than 2% and 8 declining more that 6%.
Topping the list of peak decliners by state is California at -14.72%, Michigan at-13.48%, Nevada at -11.50%, Florida at -8.51%, Washington DC at -8.07, Arizona at -7.11%, Massachusetts as -6.34% and Rhode Island at -6.02%.
 Topping the list of year-over-year decliners by state is California at -11.49%, Nevada at -9.35%, Michigan at -8.82%, Florida at -8.51%, and Arizona at -6.52%.
 The OFHEO HPI series is formulated from home purchase and refinance information collected from Fannie Mae and Freddie Mac and as such suffers slightly from some basic limitations of the data.
First, Fannie and Freddie mortgages are subject to conforming loan limits which eliminates huge portions of data that are particularly relevant given the current bloated state of home prices.
A great percentage of home purchases made in the last decade, especially in the bubbliest areas, were made with Jumbo loans that, by their definition, exceed the Fannie-Freddie conforming loan limits and as such are not included in the OFHEO data.
Also, data from mortgages made for the purpose of refinance are also included which may have a tendency to skew the HPI series.
Fortunately, OFHEO now produces “Purchase Only” indices (i.e. HPI indices derived only from home purchase mortgage data only) for all census and states statistical areas.
In general, because the “Purchase Only” indices are based on home price changes from only home purchase transactions, they tend to show a greater degree of deceleration and/or decline than the complete data indices and may be a better indicator of the overall state of each particular housing market.
Although it’s generally recognized that the S&P/Case-Shiller (CSI) home price indices are more accurate than the OFHEO indices, OFHEO offers data for over 400 different census, state and metropolitan statistical areas compared to only 20 major metro areas for the CSI.
Be sure to check out the PaperEconomy OFHEO HPI Charting Tool allows you to visualize the HPI data as well as compare data from different areas.
Additionally, the tool now fully supports the “Purchase Only” data as well as allowing you to “normalize” the data in order to make a true comparison from one area to another.
On a side note, OFHEO will now be reporting home price data for the major Census divisions monthly so I will be adding that report to the rotation of monthly economic posts.