 The Mortgage Bankers Association (MBA) publishes the results of a weekly applications survey that covers roughly 50 percent of all residential mortgage originations and tracks the average interest rate for 30 year and 15 year fixed rate mortgages, 1 year ARMs as well as application volume for both purchase and refinance applications.
The purchase application index has been highlighted as a particularly important data series as it very broadly captures the demand side of residential real estate for both new and existing home purchases.
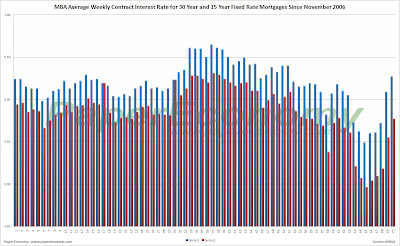
The latest data is showing that the average rate for a 30 year fixed rate mortgage jumped 18 basis points since last week to 6.27% while the purchase application volume increased slightly by 0.2% and the refinance application volume collapsed, plunging 30.4% compared to last week’s results.
The average fixed mortgage rate has again climbed significantly since last week and now is nearing the highs seen during the initial stages of the 2007 credit debacle resulting in the obvious plunge in refinance volume and flat purchase application volume.
It’s important to note that all application volume values reflect only “initial” applications NOT approved applications… i.e. originations… I will post on originations on the coming weeks.
Also note that the interest rate for an 80% LTV 1 year ARM now rests 55 basis points below the rate equal to an 80% LTV 30 year fixed rate loan.
It’s important to note that the data is reported (and charted) weekly and that the rate data represents average interest rates, and the index data represents mortgage loan application volume for home purchases, home refinances and a composite of all loans.
The following chart shows how the principle and interest cost and estimated annual income required to cover the PITI (using the 29% “rule of thumb”) on a $400,000 loan has changed since November 2006.
 The following chart shows the average interest rate for 30 year and 15 year fixed rate mortgages over the last number of weeks (click for larger version).
 The following charts show the Purchase Index, Refinance Index and Market Composite Index since November 2006 (click for larger versions).

