Showing posts with label subprime. Show all posts

Thursday, November 08, 2007

The Almost Daily 2¢ - The Subprime Ruse

Suprime is a far too convenient concept for those who would like to depict the housing downturn as contained.

Although it has been correctly associated with the first wave of housing boom borrowers who, having poor credit quality at the outset, are now undergoing tremendous stress as housing values decline, rates reset and lending standards tighten, it is just the bleeding edge.

We have to keep in mind that the key difference between a “prime” and “subprime” borrower is, in general, simply their FICO score… essentially the credit rating on the individual borrower themselves.

This makes for a pretty tenuous distinction given that prime and subprime borrowers alike gorged on the fruits of the exotic mortgage era with equal ferocity and neither is totally immune from the effects of a declining housing market and recessionary economy.

Sure, the borrowers with the weakest credit histories and holding the worst loans are going to collapse first but the notion that the prime marketplace will simply float along unscathed is simply naïve.

We have already seen significant stress coming from no-low documentation loans (i.e. home loans made with no income verification) regardless of the credit quality of the borrower.

Many of these loans were used by housing boom “investors” who turned to them as a means of borrowing far more money than they would ever have been extended otherwise.

As we all know, there was a tremendous movement to “invest” in residential real estate during this housing boom.

In fact, the share of existing homes being purchased as a “second” home went from a mere 7% in 2000 to a whopping 39.9% in 2005 and before you jump to some anecdotal notion of baby Boomers buying vacation homes, roughly 83% of these were reported to be for “investment” purposes leaving only 17% for pure leisure.

That represents an awful large cohort of homeowners who will undoubtedly continue to face tremendous stress as the market continues downward.

Lastly, consensus currently, but wrongly, holds the notion that the prime “primary residence” single family and condo homeowner have been largely unaffected by the downturn.

In fact, prime borrowers with adjustable rate loans have been entering foreclosure at an increasing rate and surpassing historical norms.

As the unwinding continues and the economy slows, mortgage stress will be felt widely, across ALL participants and for all products, likely concluding, in my estimation, with the prime Jumbo fixed rate borrowers.

Tuesday, September 11, 2007

The Daily 2¢ - Opps! Spoke Too Soon


Krikies!

Remember all the stuff I wrote yesterday about recent congressional actions being limited and not qualifying as a federal bailout? Well you can just scratch all that.

In a really disturbing and outright reckless move, New York Senator Charles Schumer (D-NY) yesterday publicized details of a soon to be introduced bill that, if enacted, would both raise the portfolio caps on Fannie Mae and Freddie Mac by 10% ($145 billion with $72 billion being allocated for refis of rate shocked mortgages) and increase the conforming loan limit to as much as $625,500 in “high cost” metro areas.

In his statement, Schumer stated that by enacting the “Protecting Access to Safe Mortgages” act, the federal government would be “deploying Fannie and Freddie to do the job they were designed to do.”

Obviously, the devil will be in the details but what I find most alarming is the possibility of the GSEs (and the federal government by a supposed but tenuous promise) stepping into the role as Jumbo lender of choice for the housing bubble’s metro markets.

Schumer’s suggestion that Fannie and Freddie were “designed” to lend up to $625,000 buyers of metro areas single family homes is both offensive and preposterous.

Originally created during the throws of the Great Depression, Fannie Mae and later Freddie Mac were designed to bring liquidity into the nation’s housing markets and help foster affordable housing NOT offer the most affluent of Americans a “government guaranteed” loan on their trade up to a luxury metro home.

What is it with this conforming limit anyway?

If it’s not the OFHEO director refusing to lower the limit, even after two consecutive years of declining home prices, it’s Congressmen like Senator Schumer and Representative Barney Frank (D-MA) proposing to raise it by as much as 50% simply to buy the housing bubble some more time.

And what about affordability in the metro areas?

How will it help the metro housing markets to support the artificially inflated home values that leave hordes of first time homebuyers permanently sidelined?

This is just completely idiotic and ill conceived.

The government is seriously risking getting in the way of a much needed correction in home prices that will materialize one way or another.

If the correction is left unfettered it will be destructive but likely come quickly and resolve as the market works through the damage and resumes some level of normal historical growth.

By tinkering in the market to extent proposed by Senator Schumer, the federal government will likely cause the housing correction to be draw out, with multiple failures and false bottoms, causing a slow bleed that could last for many years (i.e. the Japan model).

Be sure to let Senator Schumer know what you think of his proposal.

Thursday, August 23, 2007

Lenders Cutting Back!

This one is clearly in the “a picture says a thousand words” category.

The following image (click for much larger version) is a series of underwriting guideline matrices for a famous, nationwide lender that was published back on March 5 but I have marked it up to make it current based in the most recent sheet published August 20.

The items NOT crossed out are what are left for possible loan production!

Friday, August 17, 2007

The Daily 2¢ - Jumbo Down and the Fed Discount Rate Cut


I hate to belabor this point but I really think that the vanishing of the affordable prime Jumbo loan is easily the most significant development for home prices that I have heard all year.

Remember, the Jumbos have dried up for PRIME borrowers.

But what does it mean to say “dried up”… again, as I noted before, it simply means borrowers will need to put 20% down (or have 20% equity for refinance), provide full disclosures of income (tax returns, stubs, etc.) and then pay over 7.5%.

This appears to have happened merely because Wall Street, who inevitably supplied the liquidity behind these loans, are now obviously more risk averse and are effectively unwilling to cheaply underwrite large home loans.

And the cheap Jumbos are not coming back anytime soon.

Why?

These loans are for the most qualified borrowers at the higher end of the income spectrum so you have to ask yourself… what is wrong with affluent borrowers being required to put 20% down, verify income, and pay a premium for a large principle loan?

The key point here is that the terms have just come back to normal… NOT tightened!

Also, remember that, unlike the subprime issue, there is not even the slightest chance that any government program, Fannie, Freddie, FHA, VA, etc. or for that matter any politician can do or will do ANYTHING about it.

People who currently have rate-resetting large principle loans or are planning to get one for a new purchase are on their own.

Again why is this important?

Because, in the last 5 years (really the last 10 years in the ultra-hot bubble metro markets) it’s NOT been the Vanderbilt’s who have been making use of Jumbo loans… it’s been the middle class dual income couple (DINKS and with kids) and the upper middle class professional individual.

The out of control spiraling buying mania forced virtually everyone in the bubble metro’s to stretch ever higher for the brass ring of the coveted residential property.

Whether it was for a starter single family, rehabbed single, simple or luxury condo, affordable Jumbos with low down payments were a KEY element in enabling the prime home buyer to function in these areas.

This is the major shoe to drop for the ultra-inflated home prices in this cycle.

As for today’s Fed discount rate cut… Don’t look for that kind of Federal Reserve action to restore the easy lending days of the past.

At this point, lenders, banks and Wall Street alike are merely concerned with how to stabilize their operations, preserve capital and stay solvent NOT how to maximize profits by ignoring risk.

Thursday, August 16, 2007

The Daily 2¢ - Jumbo Mortgage Avalanche


The times they are a changin’… and FAST TOO!

One week the Bulls are celebrating the “Goldilocks Economy” and DOW 14000 the next, a worried crisis-laden Larry Kudlow is stammering kookily about some crazy idea that the Federal Reserve should be buying up all the subprime and jumbo mortgages in order to prevent financial collapse… and in front of Robert Shiller no less!

Among the tumult surrounding Countrywide Financial and other mortgage lenders, yesterday’s business media was peppered with a slightly new and possibly more significant source of trouble for the nation’s housing markets, particularly for the hyper-inflated ultra-bubbly metro areas.

The availability of “Jumbo” mortgages, i.e. mortgages that exceeded the current OFHEO limit for Freddie Mac and Fannie Mae conforming loan status (currently $417,000 for a single family home), have essentially ground to a halt.

I say essentially because you can still get a Jumbo loan provided you give full documentation of your income (tax returns, pay stubs etc.), put down 20% on the purchase and are willing and able to finance the remaining principle at an over 7% interest rate.

Use Bankrate.com now and see for yourself… fixed rate, ARM, Interest Only… it doesn’t matter they are virtually all over 7% and almost non-existent if you’re not putting down 20%.

This is a kiss of death for the bubble-metro areas where home prices, even for the most modest starter homes, are still ridiculously inflated after having been pumped up by years of a loose lending induced buying mania.

The availability of cheap Jumbo’s is absolutely necessary for these areas to maintain any volume and fluidity of home sales, now they are gone and the first signs of the impact should be seen in the home sales statistics compiled during the next several months.

We have definitely reached another major turning point in the housing meltdown story as this will likely be the start of the most significant period of downward price adjustment in this cycle.

But wont things just snap back if the Fed cuts rates?

Not in my estimate.

To use an analogy, the mortgage meltdown is like an avalanche.

Friction exceeded its critical limit and the whole of the market has come crashing down the mountain.

Some lenders were instantly killed as pieces of debris crashed through their midsections; others are buried out of sight deep within the pile and, struggle as they might, will simply suffocate before they are able to resurface.

Still others are stuck in various ways but will go so far as to gnaw off arms and legs and stumble, bloody and hemorrhaging down to safety and a possible handicapped recovery.

A lucky few are simply trapped in shallow caves whereby, through a lot of digging, they will eventually free themselves, relatively unscathed but still bruised and shaken.

All the dead and survivors will share one thing in common though… none will be returning up the hill for some time to come.

P.S. I thought I might use another natural disaster analogy but with the earthquake in Lima Peru, a Tsunami threat in the Pacific, Hurricane Flossie hitting Hawaii, and tropical storms Erin in the Gulf and Dean in the Caribbean, I thought it might be in better taste to choose the avalanche!

New Residential Construction Report: July 2007

Today’s New Residential Construction Report continues to indicate horrendous weakness in the nation’s housing markets and for residential construction showing substantial declines on a year-over-year basis to single family permits both nationally and across every region.

Single family housing permits, the reports most leading of indicators, again suggests extensive weakness in future construction activity dropping 24.0% nationally as compared to July 2006.

Moreover, every region showed high double digit declines to permits with the West declining 20.4%, the South declining 27.8%, the Midwest declining 22.3% and the Northeast declining 11.3%.

Keep in mind that these declines are coming on the back of last year’s record declines.

To illustrate the extent to which permits and starts have declined, I have created the following charts (click for larger versions) that show the percentage changes of the current values compared to the peak years of 2004 and 2005.

Notice that on each chart the line is essentially combining the year-over-year changes seen in 2005 and 2006 and shows virtually every measure trending down precipitously.

Although year-over-year declines to permits, for example, have not accelerated measurably from September 2006, the fact that they continue to decline roughly 20%-30% should provide a solid indication that they are by no means stabilizing.


Remember that permits, starts, and competitions are not simply independent measures but are, in fact, three logically related and dependent measures.

In the process of a building project, first you get the “permit”, next you “start” building, and finally you “complete” the project.

For this reason, one must adjust expectations prior to reading a newly released Census Department report to account for the true nature of the data published simultaneously each month.

As in past months, I have “smoothed” (see last post for full details on smoothing process) out the unadjusted data and aligned the three data series (i.e. moved starts ahead a month and completions ahead six months) to make more obvious their trend.

Here are the statistics outlined in today’s report:

Housing Permits

Nationally

  • Single family housing permits down 1.6% from June, down 24.0% as compared to July 2006
Regionally

  • For the Northeast, single family housing down 1.1% from June, down 11.3% as compared to July 2006.
  • For the West, single family housing permits down 1.6% from June, down 20.4% as compared to July 2006.
  • For the Midwest, single family housing permits down 7.5% from June, down 22.3% as compared to July 2006.
  • For the South, single family housing permits up 0.4% from June, down 27.8% compared to July 2006.
Housing Starts

Nationally

  • Single family housing starts down 7.3% from June, down 25.4% as compared to July 2006.
Regionally

  • For the Northeast, single family housing starts down 12.0% from June, down 7.8% as compared to July 2006.
  • For the West, single family housing starts down 6.4 from June, down 21.2% as compared to July 2006.
  • For the Midwest, single family housing starts down 9.2% from June, down 25.8% as compared to July 2006.
  • For the South, single family housing starts down 6.2% from June, down 29.5% as compared to July 2006.
Housing Completions

Nationally

  • Single family housing completions down 4.0% from June, down 27.7% as compared to July 2006.
Regionally

  • For the Northeast, single family housing completions down 29.3% from June, down 38.3% as compared to July 2006.
  • For the West, single family housing completions up 5.6% from June, down 19.4% as compared to July 2006.
  • For the Midwest, single family housing completions down 14.7% from June, down 44.9% as compared to July 2006.
  • For the South, single family housing completions down 0.5% from June, down 23.5% as compared to July 2006.
Keep in mind that this particular report does NOT factor in the cancellations that have been widely reported to be occurring in new construction.

Wednesday, August 15, 2007

Countrywide Bankruptcy?


Hmmm… I Wonder what happened to Mozilo, Sambol and Sieracki’s “top-conditioned athlete”?

Today, Merrill Lynch managed to finally downgrade Countrywide Financial (NYSE:CFC) to a “sell” from their recent “buy” stance adding an additional little tidbit that “it is possible for CFC to go bankrupt”.

Great! Thanks… A “Buy” one day, “Sell” it may go bankrupt the next!

Superb Work… I love Wall Street.

On a serious note, you have to wonder how the leadership at Countrywide could have felt so certain of the fundamental strength of their business that they not only suggested that they would survive the downturn but, in fact, stated that the company would actually “benefit” from the inevitable industry consolidation that would ensue from market turmoil.

Were they simply inexperienced, unable to see the true nature of the historic housing run-up and inevitable proportionate bust and prepare the company adequately for possible systemic risk OR was something else afoot?

In any event, yesterday Countrywide released their July Operational Results showing again that delinquencies and foreclosures are continuing to rise with delinquencies jumping 64.58% and foreclosures soaring 126.09% since July of 2006.

Prior to January 2007, Countrywide reported foreclosure data as a percentage of the total number of loans serviced which obviously lacked complete clarity.

Below, are charts of both measures; foreclosures by total number of loans serviced and foreclosures by percentage of unpaid loan principle (Click for larger versions).

Either way you slice it, Countrywide is looking at some significant increases in foreclosure activity but notice that for the “unpaid loan principle” method, things are really looking dire.

Be sure to check out the Countrywide Financial Foreclosures (REO) Blog’s Inventory Tracker for some more startling evidence that foreclosures are skyrocketing over at Countrywide Financial as well as some excellent REO tracking features.


Homebuilder Blues: NAHB/Wells Fargo Home Builder Ratings August 2007

Today, the National Association of Home Builders (NAHB) released their Housing Market Index (HMI) showing additional evidence that the new home market is experiencing a new leg down in declines.

The release came along with what the country’s bubbliest and overly inflated housing markets should considered a significantly alarming perspective from Chief Economist David Seiders.

“There is no question that problems in the subprime mortgage sector have spilled over to other components of housing finance, including the Alt.-A and jumbo markets, delaying a revival of the single-family housing market,”

Measuring builder confidence across six key data points, the builder survey has been a bellwether for the new home market since 1985.

The component measures used to formulate the overall HMI are respondent ratings on “present conditions”, “future conditions” and “buyer traffic” all of which continue to indicating significant current and future weakness as the new home market slumps its way slowly forward, now long separated from an exceptionally disappointing spring selling season.

In fact, July’s “present”, “future” and “buyer traffic” condition results have moved even nearer to the worst levels seen since early 1991 when the nation’s housing market was slumping through its last major housing bust.

The following charts show “present conditions”, “future conditions” and “buyer traffic” both smoothed since 1986 and unadjusted since 2005 (click for larger versions).

Keep in mind that for each measure respondents are asked to assign both a “good” and “poor” rating so in each chart you will notice “good” slumping while “poor” is surging.


Reading Rates: MBA Application Survey – August 15 2007


The Mortgage Bankers Association (MBA) publishes a weekly applications survey that covers roughly 50 percent of all residential mortgage originations and tracks the average interest rate for 30 year and 15 year fixed rate mortgages as well as application volume for both purchase and refinance applications.

The purchase application index has been highlighted as a particularly important data series as it very broadly captures the demand side of residential real estate for both new and existing home purchases.

The latest data is showing that the average rate for a 30 year fixed rate mortgage increasing marginally since last week and now stands at the near peak for the year at 6.45% while the purchase volume increased 3.9% and the refinance volume increased 2.6% compared to last weeks results.

It’s important to note that the data is reported (and charted) weekly and that the rate data represents average interest rates, and the index data represents mortgage loan application volume for home purchases, home refinances and a composite of all loans.

The following chart shows how the principle and interest cost and estimated annual income required to cover the PITI (using the 29% “rule of thumb”) on a $400,000 loan has changed since January 2007.

The following chart shows the average interest rate for 30 year and 15 year fixed rate mortgages over the last number of weeks (click for larger version).

The following charts show the Purchase Index, Refinance Index and Market Composite Index since January 2007 (click for larger versions).


Friday, July 27, 2007

GDP Report: Q2 2007 Advance


Today, the Bureau of Economic Analysis (BEA) released their first installment of the Q2 2007 GDP Report showing higher than expected growth of 3.4%, buoyed by strength in nonresidential structures and federal, state and local government spending while continuing to be weighed down by weakness to fixed residential investment.

It’s important to keep in mind that today’s results are very preliminary and will not be finalized for another two installments.

Additionally, today’s report reflected a revision to the national income and product accounts (NIPAs) which resulted in revisions to virtually every estimate since 2004.

As a result of the NIPA revision, previously reported estimates of residential fixed investment were generally revised lower resulting in an even greater impact on the GDP results seen in 2006 and 2007.

Residential fixed investment, that is, all investment made to construct or improve new and existing residential structures including multi–family units, continued its historic fall-off registering a decline of 9.3% since last quarter while shaving .49% from overall GDP.

Housing continues to be, by far, the most substantial single drag on GDP subtracting an amount roughly equivalent to the contributions made by all exports during the quarter.

The following chart shows real residential and non-residential fixed investment versus overall GDP since Q1 2003 (click for larger version).

Friday, June 29, 2007

OFHEO’s Absurd Sleight of Hand

This week the Office of Federal Housing Enterprise Oversight (OFHEO) published a request for public comment regarding its proposed policy changes to the procedures used to determine the conforming loan limit for 2008 and beyond.

The conforming loan limit is the maximum loan size that the Government Sponsored Enterprises (GSE), namely Fannie Mae and Freddie Mac, can purchase and today stands at $417,000.

The importance of this value should not be overlooked as it is the key determining factor that distinguishes GSE purchased loans, which generally come with a lower interest rate due to a presumed (yet not necessarily factual) government guarantee, from “Jumbo” loans which are available unfettered from private lending institutions.

In fact, OFHEO considers loans purchased by a GSE in excess of its conforming loan limit to be “unsafe and unsound practice, running contrary to statute”.

That said, the proposed changes relate to the method of determining the limit in the face of declining home prices.

First, it’s important to note that the method for determining the limit when prices are climbing is relatively simple.

The Federal Housing Finance Board (FHFB) confidentially delivers the results of their October Monthly Interest Rate Survey (MIRS) to OFHEO which intern applies a calculation to the average home price to determine the new maximum lending limit.

OFHEO then announces publicly the new limit for loans made during the following year.

Simple enough… October average home price + some calculation = new maximum limit.

So what is the issue you say?

It seems that OFHEO is struggling with the idea of applying that same simple methodology when prices are on the decline.

Reading the proposed procedures, it’s clear that the government has a bias toward inflating home values and is doing just about everything it can to maintain the current limit under the guise of not negatively impacting the market.

This is really an outrageous matter when one considers that the ever increasing limit, that was even a surprise to mortgage brokers and lenders during the boom years, had without a doubt contributed to fueling the housing mania.

With the proposed changes, a downward revision to the limit, even in the face of falling home prices, may be deferred for as long as 2-3 years or more.

I would strongly urge that you let OFHEO know what you think of their proposed changes as well as making your own recommendations by emailing OFHEO at the following email address ofheoguidancecomments@ofheo.gov.

Below are the proposed procedures for setting the limit when home values are declining:
  1. In a year in which the October house price level is lower than the level of the previous October, OFHEO will defer the impact of that decline on the conforming loan limit for one full year. The effect of the price level decline of 0.16% from October 2005 to October 2006 was deferred in this manner.

  2. After deferring the impact of a decline in the average price level for one year

    (A) if the price level falls in the following year, the latter decline will be deferred one year, and the maximum loan limit will be adjusted by the decline of the former year. However, the decrease will be deferred to the next year unless it exceeds one percent (1%); or
    (B) if the price level increases the following year, then the prior year’s (or years’) decline(s) will be subtracted from such increase, unless such subtraction(s) result(s) in a decrease of less than 1%, in which case such decrease will be carried forward to the next year.

  3. All loans that were within the conforming loan limit at the time of origination will continue to be deemed within the conforming loan limit during the remaining lives of such loans, regardless of whether the loan limit for any subsequent year declines to a level below the limit at the time of origination.
And here is an example of the actual implementation of these procedures:

In November 2007,

(a) if the average house purchase price has gone up during the year, for example by 2 percent, the deferred decline of 0.16 percent would be subtracted, and the new loan limit beginning January 2008 would show an increase of 1.84 percent.

(b) if the average house purchase price has gone up during the year, for example by 0.10 percent, then the deferred decline would offset that 0.10 percent increase and a 0.06 decline would be carried forward. The conforming loan limit would remain the same at $417,000.

(c) if the average house purchase price has gone down, the conforming loan limit will remain at $417,000 for 2008.

The deferred decline will be added to the 0.16 percent and carried forward until the next calculation in November 2008, as follows:

(i) if the average house purchase price goes up during 2008, the conforming loan limit will be calculated per (a) or (b) above with the offset being the cumulative deferred decline of 0.16% and the November 2007 decline;

(ii) if the average house purchase price goes down during 2008 and the cumulative deferred decline of 0.16 percent from 2006 and the decline from 2007 coupled with the 2008 decline still total less than 1 percent, the conforming loan limit would remain at $417,000 in 2009; or,

(iii) if the average house purchase price goes down during 2008 and the cumulative deferred decline of 0.16 percent from 2006 and the decline from 2007 and 2008 totals 1.0 percent or greater, then the conforming loan limit for 2009 will be adjusted downward by that cumulative deferred decline.

Tuesday, June 26, 2007

New Home Sales: May 2007

Today, the U.S. Census Department released its monthly New Residential Home Sales Report for May showing renewed declines and a 5.10% downward revision to last month’s unexpected “surge”.

As with prior months, on a year-over-year basis sales are still declining in the double digits at 15.8% below the sales activity seen in May 2006.

It’s important to keep in mind that these declines are coming on the back of the significant declines seen in 2006 further indicating that the decline is not abating.

This should not be understated as it is clearly showing continued and even accelerating weakness to new home sales.

The following charts show the extent of sales declines seen since 2006 as well as illustrating the further declines 2007 is showing on top of the 2006 results (click for larger versions)

Note that the last chart essentially combines the year-over-year changes seen in 2005 and 2006 and shows sales trending down precipitously as compared to the peak period.


Look at the following summary of today’s report:

National

  • The median price for a new home was down .88% as compared to May 2006.
  • New home sales were down 15.8% as compared to May 2006.
  • The inventory of new homes for sale declined 5.0% as compared to May 2006.
  • The number of months’ supply of the new homes has increased 14.5% as compared to May 2006.
Regional

  • In the Northeast, new home sales were up 19.1% as compared to May 2006.
  • In the West, new home sales were down 21.1% as compared to May 2006.
  • In the South, new home sales were down 17.9% as compared to May 2006.
  • In the Midwest, new home sales were down 21.1% as compared to May 2006.

S&P/Case-Shiller: April 2007

Today’s release of the S&P/Case-Shiller home price indices for April continued to show weakness for the nation’s housing markets with 14 of the 20 metro areas tracked reporting significant declines.

Topping the list of decliners on a year-over-year basis was Detroit at -9.35%, San Diego at -6.70%, Washington DC at -5.70%, Tampa at -4.97 and Boston at -4.52%.

Additionally, both of the broad composite indices showed accelerated declines slumping -2.69% for the 10 city national index and -2.13% for the 20 city national index resulting in the first negative appreciation on an annual basis since the 1990-1991.

To better visualize the results use the PaperMoney S&P/Case-Shiller/Futures Charting Tool and be sure to read the Tutorial in order to best understand how best to utilize the tool.

Additionally, in order to add some historical context to the perspective, I updated my “then and now” CSI charts that compare our current circumstances to the data seen during 90s housing decline using BOTH annual and "peak" percentages changes.

To create the following annual charts I simply aligned the CSI data from the last month of positive year-over-year gains for both the current decline and the 90s housing bust and plotted the data with side-by-side columns (click for larger version).

What’s most interesting about this particular comparison is that it highlights how young the current housing decline is, having only posted four consecutive year-over-year (YOY) monthly declines to home prices.

Looking at the actual index values normalized and compared from the respective peaks, you can see that we are only ten months into a decline that, last cycle, lasted for roughly fifty four months during the last cycle (click the following chart for larger version).


The “peak” chart compares the percentage change, comparing monthly CSI values to the peak value seen just prior to the first declining month all the way through the downturn and the full recovery of home prices.

In this way, this chart captures ALL months of the downturn from the peak to trough to peak again.

As you can see the last downturn lasted 97 months (over 8 years) peak to peak including roughly 43 months of annual price declines during the heart of the downturn.

Notice that peak declines have been FAR more significant to date and, keeping in mind that our current run-up was many times more magnificent than the 80s-90s run-up, it is not inconceivable that current decline will run deeper and last longer.

Wednesday, June 13, 2007

Homebuilder Hoedown!


Yesterday JP Morgan held their Basics and Industrials Conference bringing together, amongst others, a host of top homebuilding executives to present their outlook for the new home business going forward.

Many homebuilders shared some particularly revealing insights in an effort to set the record straight on issues ranging from the subprime meltdown to DR Horton CEO Donald Tomnitz’s use of the word “suck”.

During the Hovnanian presentation, CEO Ara Hovnanian talked at length about current and future land purchasing as well as his take on raising interest rates.

When asked about their prospects for new land purchases, Hovnanian answered:

“I can tell you our new land purchases are down to a trickle right now, we had been looking and the reality is again, we’ve seen every cycle, the land sellers are always the last to recognize the housing slowdown and hat typically has happened is that housing prices have come down first, and the land prices ultimately come down but they’re always trailing. While prices come down and terms come down, they never come down to equal housing prices till much later in the down-cycle.

When we do new land purchases, we have to make our threshold returns at current net-net prices after all incentives and concessions and net-net absorptions after all cancellations. Today, we’re finding very very few land parcels that meet that criteria and frankly, with the market in transition and without being very stable and now with our greater focus on cash flow, I can’t say we’re anxious to go out and buy some land right now.

We have probably gone from 20,000 (properties) to less then 1,000 that we have purchased in the last six months so it’s dropped dramatically and I don’t see that changing over the next six months.”

When asked at what point mortgage rates would begin to effect buyer ability to purchase new homes, Hovnanian responded:

“It’s hard to predict that, I can just say this, prices of homes have corrected dramatically that makes all housing a lot more affordable without a doubt. The lower the mortgage rates, obviously, the more helpful it is. Psychologically, I used to say over 8% was probably the point where it starts to become more harmful, today if long rates go over 7% I just think psychologically it may be more of a barrier but we’re a ways from that right now. I think we’ve got lots of things to worry about in the homebuilding business, personally I don’t think mortgage rates are high on my radar screen of big concerns. I just think that there are other risks or factors that we’re more concerned about than interest rates.”

Listen to the entire Hovnanian presentation here.

During the Toll Brothers presentation, Fred Cooper, Senior Vice President of finance and investor relations was asked about the outlook for impairment charges resulting from land write-downs for which he responded:

“In total we’ve had about $360 million in write-downs over the last three quarters, about $250 million of it has been on owned land and then $110 million on optioned land. Generally I think more of the write-downs have come on land that is less mature where they were put under option based on stronger market assumptions. … Most of the write-downs are on land that is relatively newer and we can’t really predict what the next couple of quarters will bring in terms of write-downs but if the market, in a particular community weakens, that could tip it over the edge. It’s very hard to predict and when we gave our guidance for 2007 recently on our call we said that we’re not able to predict future write-downs at the moment.”

Listen to the entire Toll Brothers presentation here.

During the DR Horton presentation, CEO Donald J. Tomnitz provided, as usual, many candid tidbits.

Discussing the fact that DR Horton had the lowest impairments for the industry, Tommnitz stated:

“I know we have been criticized by many for not having as many impairments, it’s amazing to even get criticized for, I think, operating perhaps a better company than other. But let me tell you a couple of reasons why I think we have had fewer impairments at least then others. One is, clearly I think we are more astute land buyers. Ok, you can look at that and say “Punk, you can’t prove that” well as we move through the market we’ll find out whether I’m right or wrong. I think the second part of that is that we have never done any JVs, we have inherited JVs so as a result we have always had a policy in our company of not doing deals that are too large for us. If we had a deal that was too large, we would pass. And many of the impairments are coming from deals that people did that were too big at the time.”

When asked about the effects of the subprime meltdown, Tommitz stated:

“I believe I’m correct in saying, when I was out in Phoenix last week, FHA is in the process of, in the next 60 days you’ll see them implement some new mortgages which basically are going to include 100% loans. I have no idea why they are going there but they’re going to include 100% loans. And as a percentage overall, if you talk to all of our division presidents, the subprime, alt-a scenario has been totally overblown by the media and we don’t believe its had a significant impact on our business.

What has had a significant impact on our business and what I think it’s going to take to get the homebuilding business back clearly on its feet is that we still have excess inventory on the marketplace. We have too many homes under construction that are unsold. I think all the builders are doing a great job in terms of starting fewer homes because that’s what we need to do.”

“I was in Phoenix, the level of existing homes that have been historically on the market in Phoenix has been about 25,000 right now in Phoenix it sits around 52,000. In Las Vegas it’s supposed to be about 20,000 it sits today at about 40,000. But we’re not receiving as much direct competition, as all of you would like to believe, from existing home buyers. And why? Because the investors bought homes from us. And they typically bought them at 100% financing. So, they bought a home from us at $270,000 that same home today we may be selling for $250,000. So, there are going to have to do one of two things. They’re either going to have to keep that home and rent it for the next two to three years till the prices come back up to $270,000 or they’re going to have to sell the home for $250,000 which is what we’re selling the home for today. I don’t know about you, but you can to Mr. and Mrs. America and there aren’t many people who can take that $270,000 and sell it for $250,000 and take a $20,000 check from their bank to the title company and close the transaction. So those existing homes are going to be leased because almost all of them have 100% financing on them or a lot of them do, especially the investor loans, so we’re not really competing with that inventory.”

Later Tomnitz talked a bit about his now infamous “Suck” comment.

“One of the reasons I don’t want to interview with CNBC is that they made a big deal out of a word that, after four years in the Army, raising two teenagers, riding Harley’s and being in the homebuilding business for a number of years I had no idea the word “Suck” was a cuss word (laughter) but for any of you ah… if that bothered you and I insulted you I apologize but it just didn’t occur to me. … What I wanted to say was that the homebuilding business is going to suck for the homebuilders in 2007, but it’s going to be a windfall for the homebuyers.”

Listen to the entire DR Horton presentation here.

Tuesday, June 05, 2007

OFHEO Home Price Index: Q1 2007


Last Friday, the Office of Federal Housing Enterprise Oversight (OFHEO) published their Home Price Index (HPI) data for Q1 2007 showing continued deceleration of home price appreciation in most regions as well as outright declines in many states and metropolitan areas.

The current installment shows declines to the East North Central and New England census regions as well as to 25 states (using “purchase only” data) including Michigan, Massachusetts, Californian, and Florida and a whole host of Metropolitan Statistical Areas (MSA).

I have updated my OFHEO HPI Charting Tool by both updating the data as well as adding some additional features that make the tool more powerful but first, I should mention some background on the OFHEO HPI.

The OFHEO HPI series is formulated from home purchase and refinance information collected from Fannie Mae and Freddie Mac and as such suffers slightly from some basic limitations of the data.

First, Fannie and Freddie mortgages are subject to conforming loan limits which eliminates huge portions of data that are particularly relevant given the current bloated state of home prices.

A great percentage of home purchases made in the last decade, especially in the bubbliest areas, were made with Jumbo loans that, by their definition, exceed the Fannie-Freddie conforming loan limits and as such are not included in the OFHEO data.

Also, data from mortgages made for the purpose of refinance are also included which may have a tendency to skew the HPI series.

Fortunately, OFHEO now produces “Purchase Only” indices (i.e. HPI indices derived only from home purchase mortgage data only) for all census and states statistical areas.

In general, because the “Purchase Only” indices are based on home price changes from only home purchase transactions, they tend to show a greater degree of deceleration and/or decline than the complete data indices and may be a better indicator of the overall state of each particular housing market.

Although it’s generally recognized that the S&P/Case-Shiller (CSI) home price indices are more accurate than the OFHEO indices, OFHEO offers data for over 400 different census, state and metropolitan statistical areas compared to only 20 major metro areas for the CSI.

The OFHEO HPI Charting Tool allows you to visualize the HPI data as well as compare data from different areas.

Additionally, the tool now fully supports the “Purchase Only” data as well as allowing you to “normalize” the data in order to make a true comparison from one area to another.

To illustrate how to use the tool, I will build up a simple chart that compares the data from the New England census division, Massachusetts, and the Boston-Quincy and Cambridge-Newton-Framingham Metropolitan Statistical Areas (MSA).

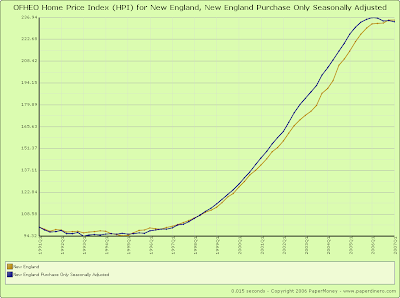
For the following chart (click to jump to the tool itself), I added the New England census division to the chart by going to the “U.S. Census Regional Division” section and “checking” New England and also “un-checking” the United States.

Then, in the section of checkboxes just under the “Update Chart” button, I checked the “Show Complete Index”, “Show Purchase-Only, Seasonally Adjusted Index (if available)” and “Normalize using base of 100” checkboxes.

Finally, I constringed the date range a bit by going to the “Date Range” section at the bottom and selecting “1991” in the first dropdown and then clicked the “Update Chart” button.


Other than the over 150% increase in New England home values seen since 1993, this chart shows that the “purchase only” index has seen a more significant increase that the “complete” index and appears to have declined more since the peak.

To get a better sense of what has gone on since the peak, let’s constrain the date range even more, by setting the starting year to “2000” in the first drop down found in the “Date Range” section at the bottom and then clicking the “Update Chart” button.


Now you can clearly see that there is a significant difference between the “purchase only” data and the “complete” data as the “complete” data series has decelerated but has not yet registered an actual decline compared to the “purchase only” data which peaked in Q1 of 2006 and has declined steadily ever since.

Since the “complete” data seems less then perfect, lets “un-check” the “Show Complete Index” checkbox found at the top and “check” the Massachusetts checkbox found in the “States and District of Columbia” section and then click the “Update Chart” button.


We can see from this chart that Massachusetts actually peaked in Q2 2005 and has been trending down ever since as well as the fact that the extent of the decline seen in Massachusetts far surpasses that seen by the New England region as a whole.

But something about this chart seem to run counter to the basic expectation that Massachusetts has the “hottest” real estate markets in New England, namely the fact that the New England data seems to peak at a higher value than the Massachusetts data.

This is because the chart is showing the two data series in “normalized” mode which, for simple comparison purposes, adjusts all the data on the chart to start with a base value of 100.

With the normalization feature you can compare two totally different data series and get a sense as to the relative changes they have made over the same time period.

In order to get the “real” view of the data, simply un-check the “Normalize using base of 100” checkbox and click the “Update Chart” button.


Now you can see that Massachusetts home prices have appreciated to a greater degree than the New England region as a whole.

But since we really do want to make a relative comparison across different data series, let’s continue with the “normalize” checkbox checked.

Now, lets add the Boston-Quincy and Cambridge-Newton-Framingham Metropolitan Statistical Areas by selecting “Boston-Quincy,MA” and “Cambridge-Newton-Framingham,MA” in the first and second drop downs found under the “Metropolitan Statistical Areas and Divisions” section then click the “Update Chart” button.


Now you can see that Boston peaked in Q1 2006, and Cambridge peaked in Q3 of 2005 while all data series declined steadily throughout 2006 and continue to decline today.

You can follow these general steps with any state and set of areas and do particularly interesting comparisons by “mixing and matching” completely unrelated areas.

Tuesday, May 29, 2007

S&P/Case-Shiller: March 2007


Today’s release of the S&P/Case-Shiller home price indices for March continued to show weakness for the nation’s housing markets with thirteen of the twenty metro areas tracked reporting significant declines.

Topping the list of decliners on a year-over-year basis was Detroit at -8.38%, San Diego at -5.97%, Boston at -4.86%, and Washington DC at -4.78%.

Additionally, both of the broad composite indices showed accelerated declines slumping -1.88% for the 10 city national index and -1.36% for the 20 city national index resulting in the first negative appreciation on an annual basis since the 1990-1991.

To better visualize the results use the PaperMoney S&P/Case-Shiller/Futures Charting Tool and be sure to read the Tutorial in order to best understand how best to utilize the tool.

Monday, May 28, 2007

Gettin’ Down with Toll

Toll Brothers (NYSE:TOL) reported Q2 earnings results last week confirming a $119.7 million of pretax write-downs that served to depress their net income by an astounding 79% as compared to Q2 2006.

Additionally, Toll yet again reduced its expectation for the maximum number of homes delivered for 2007 from 7300 homes last December to 7000 in Q1 now to 6900.

During the conference call, CEO Bob Toll uncharacteristically offered very little optimistic sentiment even offering some skepticism regarding recent Treasury Secretary Paulson’s “market bottom” outlook and the recent up-tick in the Census Department’s New Home Sales.

“I think what that indicates is that most new homebuilders that are large, the public homebuilders, their average product goes anywhere from about $250K up to us which is about $700,000 so obviously the increase [in sales] is taking place below our space. Which means that we’re not out of the woods yet. I took with surprise yesterday and it’s now confirmed today by this analysis when the secretary of the treasury said that we’ve got the hard times pretty much behind us I wondered how many communities he had and where he got that information but I now understand that the information he got hadn’t been pealed away, I guess, to show that it was $150,000 housing. So I would say that we have not got the bad times behind us yet though it could be… you never know.”

When asked about the April year-over-year comparisons getting less negative Toll suggested that favorably comparing against a year that “stinks” is not what he’s looking for.

“As you get further in to a down market, in terms of length of time, the comparisons are going to get better. So that, ultimately, if we stay here for a long period of time, you will see that April sales equaled April sales last year. That’s not what we’re looking for of course. So, I think the statements are a little misleading. The comparisons are good but what you’re comparing to stinks so that’s why your getting unhappiness expressed by the public home builders.”

Ivy Zelman, analyst with Credit Suisse First Boston tweaked Bob Toll in a minor skirmish over Toll’s interest in buying additional land.

Toll: “I would hope that we would increase the land portfolio somewhat from where we are now, we are actively looking and trying to buy… We have raised thresholds because we can and I think we should operate more prudently, more carefully than we did when the market was going up.”

Ivy: “You don’t feel that having almost a 10 year supply of land is enough?”

Toll: “Well, we hope that it’s not 10 years Ivy.”

The complete conference call can be listened to here.

Here are some of the interesting data points from the Q2 release:

Second Quarter Results

  • Net income was $36.7 million down 79.0% compared to Q2 2006.
  • Pre-tax land write-downs totaled $119.7 million up 897.5% compared to Q2 2006.
  • Earnings per share declined 66.7% as compared to Q2 2006.
  • Total revenues were $1.17 billion down 18.75% compared to Q2 2006.
  • Net signed contracts were $1.17 billion down 25% compared to Q2 2006.
  • Quarter end backlog was $4.15 billion down 31.6% compared to Q2 2006.
  • Signed contracts was 2031 down 14% compared to Q2 2006.
Current 2007 Projections

  • Deliver 6100 – 6900 homes (prior estimate 6000 – 7000).

Saturday, May 26, 2007

Crashachusetts Existing Home Sales: April 2007

This week, the Massachusetts Association of Realtors (MAR) released their Existing Home Sales Report for April 2007 showing further weakness to the regions residential housing market.

Along with the release, MAR President Doug Azarian continued to maintain an optimistic outlook on the trend.

“The housing market continued to trend in a positive direction for the month of April … While the number of detached single-family homes sold was down, the 1.7 percent decrease year-to-year was the lowest we’ve seen in the month of April for the past three years. … With inventory levels decreasing and interest rates still low, demand should continue to keep prices stable through the end of the spring home buying season,”

Probably the most notable data-point of the report is the continued increase of the average “days on the market” resulting in an increasing monthly supply.

Although the total residential inventory is lower now than in April of 2006, the sales pace is continuing to slow.

It’s important to remember that we are again seeing year-over-year sales declines “on the back” of last years historic sales drop-off indicating truly fundamental weakness.

This is inevitably resulting in climbing inventories that for some towns, such as Concord, are exceeding last years levels while many other towns continue to simply trend upward.

Use the PaperMoney Inventory Tracker to follow your town’s daily inventory as well as visualize the inventory changes that have occurred over the last year.

As in months past, be on the lookout for the inflation adjusted charts produced by BostonBubble.com for an even more accurate "real" view of the current market trend.

April’s Key Statistics:

  • Single family sales declined 3.5% from March and declined 1.7% as compared to April 2006
  • Single family median price increased 0.3% from March and declined 2.3% as compared to April 2006
  • Condo sales declined 0.7% from March and increased 0.7% as compared to April 2006
  • Condo Median Price declined 1.6% from February and increased 2.6% as compared to April 2006
  • The number of months supply of residential properties stands at 10.0 months.
  • The average “days on market” for single family homes stands at 150 days.
  • The average “days on market” for condos stands at 143 days.

Friday, May 25, 2007

Existing Home Sales Report: April 2007

Today, the National Association of Realtors (NAR) released their Existing Home Sales Report for March showing continued and uniform weakness of the nations housing markets.

Without missing a beat, the new “fill-in” Senior Economist Lawrence Yun continues to suggest that the weakness is indicating stabilization.

“We’ve been anticipating slower home sales because many subprime loan products are no longer available … In addition, increased scrutiny by lenders is stopping risky mortgage origination, which is good for both consumers and the lending community. Fortunately, a wide availability of conventional mortgage products and the 4.5 million jobs created over the past 24 months will help to stabilize the market going forward.”

Additionally, NAR President Pat Vredevoogd Combs continues to attempt to scare buyers into action with the threat of increased interest rates.

“Long-term financing remains favorable, but interest rates are rising … Although some buyers have a wait-and-see attitude regarding home prices, they should consider that rising interest rates later this year could offset a lower sales price when you get down to the monthly payments.”

Looking at March’s Existing Home Sales report should only result in additional confirmation that the nation’s housing markets are continuing to experience weakness with virtually all regions showing considerable declines to median price and sales as well as significant increases to inventory and monthly supply.

Sales are, in fact, down in EVERY region with the majority of declines in the double digits.

Keep in mind that we are now seeing existing home sales declines on the back of last years fairly dramatic declines further indicating that the housing markets are not bottoming as many had suggested last fall.

Below is a chart consolidating all the year-over-year changes reported by NAR in their April 2007 report.

Particularly notable are the following:

  • Majority of median prices are down.
  • ALL sales are down.
  • ALL Inventory and Months Supply show HIGH double digit increases on a year-over-year basis.