Tuesday, November 07, 2006

A Grim Toll

Today Toll Brothers Inc., one of the nation’s largest home builders, release their preliminary fourth quarter and year ending results showing a substantial fall off in luxury home building and buying activities.

CEO Robert Toll had this to say:

“FY 2006 has certainly been a very tough and challenging year. It is worth noting that, atypically, this housing market is weak in an environment of low interest rates and low unemployment. We believe weak buyer confidence is keeping many customers on the sidelines.

We continue to look for signs that a recovery is imminent but can’t yet say that one is in sight.

The report revealed many significant declines in business activity as well as the company’s efforts to navigate the ever weakening housing market.

In the fourth quarter, the company further reduced its land holdings, dropping another 6500 land options, thus reducing the current inventory of lots owned or controlled by 18.8% to 74,000 from a peak of 91,200 lots in 2nd quarter 2006.

The company now expects to only deliver 6300 – 7300 homes in 2007 lowering its former forecast of 7000 - 8000 homes.

The report also revealed the following grim statistics:

Full Year

  • Signed contracts dropped 37.6% to $4.46 billion compared to $7.15 billion in 2005.
4th Quarter

  • Revenues dropped 9.9% to $1.81 billion as compared to $2.01 billion in 2005.
  • Ending blacklog dropped 25.2% to $4.49 billion compared to $6.01 billion in 2005.
  • Signed contracts dropped 55.3% to $710 million compared to $1.59 billion in 2005.
  • Cancellations totaled a "higher than normal" 585 with disproportionately high 14% coming from the Orlando Florida and 11% from Northern California.

H & R “on the” Block

In another extraordinary example of a national lender struggling to adapt to the current challenging economic environment, H&R Block announced today that they will attempt to consolidate their loan fulfillment operations by closing 12 of their branch locations and possibly even selling their entire “Option One” mortgage business.

Option One, which is the nations fifth largest originator of sub-prime mortgages, has apparently been besieged this year with an unexpected increase delinquencies.

Considering that Option One wrote no less than $40 billion in sub-prime loans only just last year, there is no doubt that whatever the outcome of the consolidation effort, it will equate to a more defensive and risk-averse posture resulting in a significant decrease in loan originations.

This is yet another example of a significant structural change to the nations housing market as there will inherently be less mortgage money available to chase the current enormous and growing backlog of unsold homes.


Copyright © 2006

PaperMoney Blog - www.paperdinero.com
All Rights Reserved
Disclaimer

Monday, November 06, 2006

Greenspan Waffles!

Unbelievable!

So I suppose all the hyper-optimistic bulls on Wall Street and particularly in the real estate industry were a little quick in interpreting the “maestros” words from October.

Today, it was reported that former Federal Reserve Chief Alan Greenspan is revising the comments he made recently suggesting that the housing market had possibly bottomed.

Back in the first few weeks of October Greenspan stated to following:

“I suspect that we are coming to the end of this downtrend, as applications for new mortgages, the most important series, have flattened out,”

“There is a good chance of coming out of this in good shape, but average housing prices are likely to be down this year relative to 2005. I don't know, but I think the worst of this may well be over”

THIS MORNING Greenspan offered these observations regarding the nations housing market:

"This is not the bottom, but the worst is behind us,"

"I think that while we are past most of it there a lot of negatives..."

"we still have a ways to go on the downside, [but] it looks as though the worst is behind us"

Possibly the greatest fallout of this waffling of position is that the National Association of Realtors included Greenspan’s original comment verbatim (with some additional spin) in the “Positive Outlook” section of their “Buy Now” campaign advertisements recently run in six top US newspapers.

For all we know, this may be the precise reason Greenspan revised his statements as his credibility was clearly being hijacked by the overzealous and unabashed Realtors association.


Copyright © 2006

PaperMoney Blog - www.paperdinero.com
All Rights Reserved
Disclaimer

The “House” That NAR Built

With the recent release of their “Buy Now” newspaper ads and forthcoming radio and television campaign, the National Association of Realtors has sunk to a new and shockingly devious low.

Apparently, NAR, not simply satisfied with the “leadership” they provided while pumping up the most exaggerated and outrageous housing bubble the United States has ever experienced, now seems fit to go even a step further by trying to lure any and all unsuspecting buyers into housings depreciating abyss in a desperate and shameless act of self preservation.

Have they no conscience? Is it not enough to produce a stream of daily “releases” filled with half truths and convincing spin? Does the country really need another “get rich quick while you can” real estate crusade stuffed down its throat, especially at a time when the housing market is so obviously and dramatically in decline?

Over the last ten years, Americans have knowingly (to a greater or lesser extent) made themselves some of the worlds most debt burdened people, producing the first national negative rate of savings since the Great Depression and the housing boom is squarely to blame.

With the help of the very same real estate industry “leadership”, Americans have been coaxed to the misguided belief that their homes are giant debt vehicles, capable of being easily leveraged to produce immense and immediate wealth.

Many concepts popularized over the last decade regarding such topics as Baby Boomer demographics, immigration and construction restrictions effect on supply and demand, as well as the short term lucrative nature of residential real estate were just that… “concepts” devised or otherwise promoted by individuals with everything to gain from these ideas becoming collective wisdom.

Meanwhile, the National Association of Realtors has grown its membership, its coffers and in turn, its influence over state and federal government to unmatched heights, all to the benefit of its own inherent interests.

What other private industry association (remember, that’s exactly what NAR is by the way) has the privilege of producing and interpreting some of the country’s most important and watched economic measures (median home price, existing home sales, and pending home sales index, etc.) all the while holding an almost exclusive right, granted by its ubiquitous size and well defended control of various multiple listing service (MLS) assets, to market and broker the nations homes.

No better Ponzi scheme has ever been devised.

Unfortunately for the schemes many participants, especially the ones duped into “believing” after absorbing the National Association of Realtors latest exploit, the Great Millennium Housing Bubble is over, structurally, economically and most importantly psychologically.

Thursday, November 02, 2006

Constructing Capitulation

Clearly, October represented a “suckers rally” of sorts, led by the unparalleled optimism created when some influential figures, most notably former Federal Reserve Chief Alan Greenspan, indicated that the worst of the much feared housing correction “may well be over”.

It seemed that no amount of data could convince some analysts and economists to break from the prevailing message that housing was setting a bottom, so much so that this sentiment gained almost a “talking point”-like status on CNBC.

Now though, after observing the full measure of economic data that is obviously indicating that housing is not bottoming, and the consumer is not unstoppable, sentiment seems to be changing a bit.

Hopefully, some of these analysts and economists will see the error made by standing in the shadow of folks like Greenspan who may well have long lost their ability to provide truly independent analysis.

October gave us the following:

  • Pending home sales report showing an increasing declines, nationally and regionally, in existing homes sales especially for single family homes.
  • Beige book report indicating that the housing decline is significantly effecting a surprisingly large portion of the US.
  • New construction report showing increasing declines to construction activity in ever region of the US.
  • Existing home sales report showing continued weakness, nationally and regionally, in home sales and prices particularly for single family homes.
  • New home sales report showing continued weakness nationally and regionally as well as a significant decline in prices of new homes.
  • An unexpectedly weak GDP report made so by a significant decline to “residential investment”.
  • Durable goods report clearly showing that the consumer is pulling back on spending on traditional consumer durables.
Now, November is opening with another, significant indicator that the housing decline is having a wider impact on the overall economy with the latest release of the Commerce Departments “Construction Spending” report.

September was reported to have shown an “unexpected” drop in overall construction spending after posting a 0.3% decline with “residential construction” clearly impacting the result as it posted its sixth straight monthly decline to total dollars and the tenth consecutive year-over-year decline as a percentage change.

Key Report Details:

  • The seasonally adjusted annul rate of private residential construction spending has now dropped 8.35% from the peak set back in December of 2005.
  • Overall private residential construction spending dropped 6.9% as compared to September 2005.
  • Single Family residential construction spending dropped 12.8% as compared to September 2005.
  • The latest 6.9% year-over-year decline is the third largest percentage drop in 12 years and the greatest drop to date for this year and for this cycle.
Review the following charts (click for larger version) to see the extent of the current decline in private residential construction:


With the hindsight view of October clearly revealing considerable and even increasing weakness for housing, the consumer, and the general economy it will be interesting to see if, as November follows suit, bullish analysts and economists finally start presenting original and accurate analysis rather than erroneous and overly optimistic future forecasts.


Copyright © 2006

PaperMoney Blog - www.paperdinero.com
All Rights Reserved
Disclaimer

Wednesday, November 01, 2006

Lereah: “A Little Lower Than Expected”

Today, the National Association of Realtors released its September “Pending Home Sales” report which showed that nationally, pending home sales had declined -1.1% as compared to August.

The National Association of Realtors developed the “Pending Home Sales” index as a leading indicator based on a random sampling of roughly 20% of the month’s transactions for exiting home sales and indexed to the average level of contract activity set during 2001.

In typical fashion, David Lereah, Chief Economist of the National Association of Realtors attempted to spin the data to a more positive outlook while presenting yet another version of the now fatigued “buyers are on the sidelines” analysis. “The present level of home sales is relatively high in historic terms,” adding “The market currently is a little lower than expected as buyers try to time their entry. In the meantime, there’s some buildup in demand that will move when consumers realize that conditions are optimal for them.”

As usual, looking more closely at the results one might draw a less optimistic conclusion:

  • Nationally the index was down 13.6% as compared to September 2005
  • The Northeast region was down 15.9% as compared to September 2005. Additionally, August marks the fourth consecutive month that this region has registered activity BELOW the average activity recorded in 2001, the first year Pending Home Sales were tracked.
  • The West region was down 15.2% as compared to September 2005.
  • The Midwest region was down a whopping 18.4% as compared to September 2005. Additionally, August marks the third consecutive month that this region has registered activity BELOW the average activity recorded in 2001, the first year Pending Home Sales were tracked.
  • The South region was down 9.0% as compared to September 2005.
So it appears that, year over year, contract activity is dropping rather sharply with the All regions now showing significant declines.

So much for pending contracts pointing to further “market stabilization”.

Tuesday, October 31, 2006

Trick or Treat?

Admit it. You loved the Munster’s mansion.

Who wouldn’t like a 1313 address, or a musty smelling fully equipped dungeon or fourth floor walk up to a widow’s peak full of bats?

Oh well, maybe not but the nation’s home builders sure think Halloween makes for a great marketing opportunity.

Take a look at some of the hoopla that home builders (particularly in Las Vegas) are planning in order to attract potential home buyers:

  • KB Home offers its Street of Screams, providing families a safe trick-or-treating alternative to the traditional door-to-door candy solicitations. This year, KB will hold the free event in its Chaco Canyon neighborhood of Las Vegas.
  • Pulte Homes will host its Spooktacular Halloween from 11 a.m. to 3 p.m on Halloween. The first 250 kids will receive Trick or Treat bags, and there will be treats, music and fun for everyone. Palm Hills at Voltaire in Las Vegas.
  • Del Webb (a subsidiary of Pulte), is hosting additional Halloween events at its new neighborhoods Tuesday from 5 to 8 p.m as well as hosting the Jack-O-Lantern Family Safe Street at The Club at Aliante in North Las Vegas.
  • Centex Homes will host its Halloween Treat Street in its Giavanna neighborhood in North Las Vegas Tuesday from 5 to 8 p.m. Eleven model homes will be decorated for Halloween and open to trick-or-treaters. Activities will include a haunted house maze in one of the three neighborhood parks that connects the models.
  • First Homebuiders of Florida (a Hovnanian company) is holding an event titled the “Halloween Haunt” offering “Safe Fun and FREE trick or treating” for kids!

Well at least those home builders are keeping a “stiff upper lip” while thinking of new ways of luring in new buyers.

That’s certainly better than the desperate home builder who wrote this request for advice from BusinessWeek’s “Lonely at the Top” editor.

Or better yet then the home builder of the following Dallas area legend

The Phantom Developer of Collin County: At the height of the '90s land boom, a greedy developer rushed a subdivision into development without checking maps to see that it was an ancient Indian burial site. On the day he was to close the sale on the first lot, the hastily built model home he was sitting in split in two and collapsed because of unstable soil. They say he still haunts the offices of homebuilders across the county, answering the phone when buyers call to complain about delays and telling them, "I'll have someone out to take care of that right away ... right away ... right away ... " before his voice trails off into deathly silence.

Happy Halloween from PaperMoney!

Monday, October 30, 2006

Hey Big Spender

Listening to the Bullish banter aired on CNBC on Friday, one would easily be left with the impression that the Great American Consumer is a noble and unstoppable powerhouse, always prepared to take one for the team and spend the country into prosperity no matter what the circumstance.

Desperately grabbing for any number that could possibly be spun positively from the shockingly weak Q3 GDP report, Wall Street bulls zeroed in on the relatively strong “Real Personal Consumption” item which resulted in a 3.1% increase and additionally, the 8.4% increase to the “durable goods” sub-item that would, on the face of it, present a fairly confident posture of consumption of big-ticket, non-perishable products.

Undoubtedly, this 8.4% showing would seem to substantiate the general notion that consumers are unflappable, allowing nothing, not even an impending housing bust and possible recession, to get in the way of their flat-panel TV purchases.

But, how accurate is this analysis? Did the American consumer really increase their spending by 8.4% this last quarter on things like computers, appliances, and motor vehicles?

To find out, let’s delve into the “Durable Goods Report” released by the Commerce Department last Thursday.

First, the following chart (click for larger version) lists the results for items that fall squarely within the bounds of what would generally be considered a consumer product, that is, an item that would normally be purchased by a typical individual for personal use:


As you can see, there are lots of negative results for traditional consumer durables.

So where did the majority of that big 8.4% jump come from if not from electronic products, cars and appliances?

The answer lies in a single line item… New orders of non-defense aircrafts and parts for September.

Yes, you heard right, aircraft. After posting a 12.5% decline in July, and a subsequent 19.9% decline in August, aircraft orders unexpectedly jumped an astonishing 183.2% in September.

So, was this aircraft surge the result of equity laden homeowners using their HELOC winnings in order to finance their amateur piloting hobbies?

Nope, the airline industry apparently booked an unusual number of orders for Boeing jet liners, spending over $14 billion dollars in September alone.

So, as it appears, we may not exactly be the big spenders the traditional media and Wall Street bulls are making us out to be and given that we are about to close out the second straight year where our disposable personal income is not sufficient to pay for our personal outlays thus leaving our personal savings squarely in negative territory, you should ask yourselves, are American consumers really unstoppable?


Copyright © 2006

PaperMoney Blog - www.paperdinero.com
All Rights Reserved
Disclaimer

Friday, October 27, 2006

The Report Heard Round The World

It’s obvious, at least to this blogger, that the bulls on Wall Street and in the housing industry have been trying desperately to downplay, or even ignore the impact that the bursting national housing bubble would have on the economy.

Their high hopes and expectations are contingent upon their belief that the downturn in housing will be moderate, contained and temporary leaving the general economy free to glide quietly to a “soft landing” as it comes off this historic run-up.

Additionally, they seem so committed to this belief that it appears that no amount of data is sufficient enough to convince them otherwise.

Well, as they say, that was then, this is now…

Today, the US Department of Commerce released its “Report on Gross Domestic Product” for the third quarter of 2006, hopefully, to the genuine dismay of the many bulls eager for a contained and mild impact of the now obvious housing bust.

Easily, the most notable disclosure present in today’s report is the 17.4% decrease in “Residential Fixed Investment”.

The following is the definition of “Residential Fixed Investment” used by the Commerce Department.

Residential Fixed Investment

Investments consisting of purchases of private residential structures as well as residential equipment that is owned by landlords and rented to tenants.

Investment in residential structures consists of new construction of permanent-site single-family and multi-family units, improvements (additions, alterations, and major structural replacements) to housing units, expenditures on manufactured homes, brokers’ commissions on the sale of residential property, and net purchases of used structures from government agencies. Residential structures also include some types of equipment that are built into residential structures, such as heating and air-conditioning equipment.


As you can see, the “residential fixed investment” number is a broad category capturing everything from home construction and rehabilitation to brokers’ commissions and essential home equipment manufacturing.

To put this decline in perspective, this 17.5% decrease shaved 1.12% from the third quarter GDP or roughly equivalent to either the 1.28% GDP reduction coming from all imports of foreign goods and services (i.e. imported goods and services are always subtracted from GDP) or the 1.15% GDP contribution coming from all personal consumption services rendered (think electricity, gas, transportation, medical care, housing, etc.) during the same period.

The following are two different chart views (click for larger versions) showing the percentage change to real residential fixed investment on a quarterly year-over-year basis since Q1 2003.


Clearly, housing is showing a significant decline and its impact on GDP is real and substantial.


Copyright © 2006
PaperMoney Blog - www.paperdinero.com
All Rights Reserved
Disclaimer

Thursday, October 26, 2006

Geenspan and Today’s New Home Sales Report

Today, the U.S. Census Department released its monthly “New Residential Home Sales” report for September causing a new round of optimism in the traditional business media.

It was speculated that the reports results, showing a 5.3% increase in new home sales as compared to Augusts revised number, might be a further indication that the recent, widely publicized, perspective suggesting that the nations housing market is setting a bottom may, in fact, be accurate.

This news comes only minutes after former Federal Reserve Chief Alan Greenspan stated that he sees "early signs of stabilization" in the nations housing market with a "flattening" of sales.

This sentiment builds on a statement made earlier this month when Greenspan suggested that for housing “the worst may well be over” citing some perceived stabilization of weekly mortgage applications.

It seems Greensspan’s encouraging outlook set a tone for October, a month in which many in the real estate industry felt confident enough to not only embrace the notion that the housing market had bottomed but to reiterate it at every opportunity.

Hopefully for them though, Greenspan’s viewpoint is more accurate today than it was back in 2004 when he advised consumers to switch over to ARM loans:

"Recent research within the Federal Reserve suggests that many homeowners might have saved tens of thousands of dollars had they held adjustable-rate mortgages rather than fixed-rate mortgages during the past decade, though this would not have been the case, of course, had interest rates trended sharply upward."

Lenders, being encouraged by the Feds position then, offered many new loan products helping home-owners draw out equity in record numbers as well as home-buyers reach for every available dollar.

Is it possible that the “Maestros” outlook and advice may have finally run its course?

Are there grounds to suggest that Greenspan could possibly be suffering from a serious case of wishful thinking, motivated in part from the obvious loss of credibility that would surly ensue should the nations housing market really revert to the mean?

Remember, not only was it during Greenspan’s tenure that the nations housing market ran wildly out of control, but he left his position without doing much about it other than paying a little lip service to “frothy” markets and “exotic” lending.

Additionally, it seems that Greenspan has been attempting to distance himself from culpability of the housing bubble as his statements suggest during a recent speech:

“I don't think that the (housing) boom came from a 1 per cent Fed funds rate or from the Fed's easing. It came from the collapse of the Berlin Wall,"

In any event, the current edition of the New Home Sales report looks absolutely abysmal.

Among other things, the report showed the greatest drop to new home prices in over 35 years as the median price for a new home declined 9.7% as compared to September of 2005.

Look at the following summary of today’s report:

National


  • The median price for a new home was down 9.7% as compared to September 2005.

  • New home sales were down 14.2% as compared to September 2005.

  • The inventory of new homes for sale increased 14.4% as compared to September 2005.

  • The number of months supply of the new homes has increased 33.3% as compared to September 2005.

Regional


  • In the Northeast, new home sales were down 6.6% as compared to September 2005.

  • In the West, new home sales were down 13.6% as compared to September 2005.

  • In the South, new home sales were down 7.9% as compared to September 2005.

  • In the Midwest, new home sales were down 36.6% as compared to September 2005.


Copyright © 2006
PaperMoney Blog - www.paperdinero.com
All Rights Reserved
Disclaimer

NewsBlogger Paper Money versus David Lereah!

Yesterday, Paper Money got a very nice citation and link-back in an article entitled “Fed Keeps Interest Rate Steady As Home Sales Fall” written by Martin H. Bosworth of ConsumerAffairs.com.

In a classic “quote counter-quote” exchange, Bosworth positions this very blog as the “skeptical” response to the National Association of Realtors Chief Economist, David Lereah’s statements regarding yesterdays existing home sale report.

It’s certainly refreshing and even an important milestone to see the traditional media report the hyper-optimistic guidance of one of the real estate industry’s most notable bulls juxtaposed a healthy does of reasonable skepticism and alternative analysis.

Thanks Martin and ConsumerAffairs.com for the excellent coverage.


Copyright © 2006
PaperMoney Blog - www.paperdinero.com
All Rights Reserved
Disclaimer

Wednesday, October 25, 2006

Wind Knocked out of Windy City’s Housing

Like a veteran boxer going back for one last shot at the title only to find that he’s well past his prime, the nations housing market is getting pummeled from all sides.

Beaten, bruised, and bloodied, this contender would have been “down for the count” long ago had it not been for the persistent prodding and pumping by his handlers who shriek for more from his corner.

For shame! For this fighter, now down on one knee, is in perfect position for his opponent to t-off that final blow that will land him face down on the canvas for a long nighty-night.

To that end, the Illinois Association of Realtors announced today that in September, area home sales and median prices took a significant nosedive.

Gone are the days of double digit appreciation fueled by speculative buying, loose lending and real estate insider’s penchant for fiction, replaced now by a decline that’s accelerating with every passing day.

As has been typical with this downturn, some in the real estate industry are having difficulty adjusting to the new reality.

“In a normal Illinois housing market we tend to see a slowdown as we enter fall and back-to-school time. This report compares sales to last year’s all-time high for home sales in the month of September. What we’re seeing is a market that is going through an adjustment that is long-anticipated after several record-breaking years. We still have a market with excellent opportunities for buyers and sellers who are informed about market conditions.”

- Robert Zoretich, President of the Illinois Association of Realtors

Take a look at today’s details for Illinois and particularly the Chicago metro market:

Illinois

  • Median single family home price down 7.8% as compared to September 2005
  • Median condo price up 2.5% as compared to September 2005
  • Single family home sales down 20.4% as compared to September 2005
  • Condo sales down 17.4% as compared to September 2005

Chicago

  • Median single family home price down 0.4% as compared to September 2005
  • Median condo price up 4.2% as compared to September 2005
  • Single family home sales down 26.0% as compared to September 2005
  • Condo sales down 18.7% as compared to September 2005


Copyright © 2006
PaperMoney Blog - www.paperdinero.com
All Rights Reserved
Disclaimer

Home Prices go Up in Smoke!

Today, the National Association of Realtors released its monthly “Existing Home Sales” report for September along with some interesting analysis which paints a picture of market stabilization.

As David Lereah, Chief Economist of the National Association of Realtors puts it:

“Considering that existing-home sales are based on closed transactions, this is a lagging indicator and the worst is behind us as far as a market correction – this is likely the trough for sales, …. When consumers recognize that home sales are stabilizing, we’ll see the buyers who’ve been on the sidelines get back into the market, and sales will be at more normal levels in the wake of the unsustainable boom that we saw last year.”

Additionally, NAR President Thomas M. Stevens added:

“It appears we have passed a cyclical peak in terms of the number of homes on the market,”

In reality though, September not only marked the sixth straight month of sales declines nationally but also the greatest drop to median home prices on record.

Additionally, this month EVERY price and sales indicator was DOWN and EVERY inventory and supply indicator was UP, presenting indisputable evidence that the housing market is declining dramatically and thoroughly across every region of the US.

There should be little doubt now that the housing market is experiencing a significant correction even when looking at a national scope.

The following shows the data form all the NAR reports released today consolidated into one view:

National Statistics (Year-Over-Year as compared to September 2005)

  • Median price of all existing homes declined by 2.2%
  • Median price of existing single family homes declined by 2.5%
  • Median price of existing condos declined by 2.8%
  • Sales of all existing homes dropped 14.2%
  • Sales of existing single family homes dropped 13.8%
  • Sales of existing condos dropped 16.0%
  • Inventory for single family homes increased 33.9% to 3,200,000
  • Inventory for condos increased 42.9% to 546,000
  • The number of months supply for all existing homes increased by 58.7% to 7.3 months.
  • The number of months supply for all existing single family homes increased by 54.3% to 7.1 months.
  • The number of months supply for all existing condos increased by a whopping 72.0% to 8.6 months.

Regional Statistics (Year-Over-Year as compared to September 2005)

Northeast

  • Median price of all existing homes declined by 5.1%
  • Median price of single family homes declined by 6.7%
  • Median price of condos declined by 1.3%
  • Sales of existing single family homes dropped 11.8%
  • Sales of existing condos dropped 17.0%

West

  • Median price of all existing homes declined by 4.3%
  • Median price of single family homes declined by 3.1%
  • Median price of condos declined by 12.5%
  • Sales of existing single family homes dropped 24.7%
  • Sales of existing condos dropped 16.4%

South

  • Median price of all existing homes declined by 1.6%
  • Median price of single family homes declined by 2.2%
  • Median price of condos declined by 2.3%
  • Sales of existing single family homes dropped 7.9%
  • Sales of existing condos dropped 17.1%

Midwest

  • Median price of all existing homes declined by 2.3%
  • Median price of single family homes declined by 2.4%
  • Median price of condos declined by 0.1%
  • Sales of existing single family homes dropped 14.4%
  • Sales of existing condos dropped 11.2%

Copyright © 2006
PaperMoney Blog - www.paperdinero.com
All Rights Reserved
Disclaimer

Monday, October 23, 2006

Massachusetts Housing Poised for Collapse?

Massachusetts is now poised for the greatest yearly sales drop of single family homes in at least the 17 years that sales have been charted by the Massachusetts Association of Realtors.

Wow! Massachusetts is looking so consistently awful it’s hard to imagine anything other than a complete “reversion to the mean” occurring now.

Today, the Massachusetts Association of Realtors reported that for September, single family home sales slipped an astounding 24% as compared to September of 2005.

This brings the current year’s total of single family home sales to only 32,000, well below the 37,740 total for the first 9 months 2005.


As you can see, Massachusetts is headed for roughly 41,800 total single family home sales for 2006 or a decline of 14.1% as compared to the total yearly sales set in 2005. Note, that this estimate includes a fairly optimistic projection of only a 10% sales decline for the months of October through December.

The following chart demonstrates what this drop off would look like in the context of single family home sales since 1990. Click on it for a larger, more readable version.


Again, like last month, we have to keep in mind that we are coming off of an historic run-up in home prices fueled by the frantic speculative madness that had captivated our area for almost ten years.

As in months past, be on the lookout for the inflation adjusted charts produced by BostonBubble.com for an even more accurate "real" view of the current market trend.

Key Statistics for September 2006

  • Single Family Sales Down 23.9% as compared to September 2005
  • Single Family Median Price Down 5.3% as compared to September 2005
  • Condo Sales Down 27.8% as compared to September 2005
  • Condo Median Price stays flat at 0.0% as compared to September 2005
  • Inventory of single family homes have risen for 19 consecutive months and now stands at 43,227 units listed on the market through MLS. This represents 12.6 months of supply.
  • Single Family average “Days on Market” stands at 124 days in August as compared to 85 days for September 2005
  • Condo average “Days on Market” stands at 114 days in August as compared to 74 days for September 2005
Key Facts

  • September marks the Sixth (MAR), (ninth per The Warren Group) consecutive month of declining sales.
  • Boston leads the nation in price reductions with 46.4% of homes listed on the MLS having been reduced.
  • Residential housing (homes and condos) inventory has increased 12.8% over the past 12 months.

Copyright © 2006
PaperMoney Blog - www.paperdinero.com
All Rights Reserved
Disclaimer

What’s the Rush? How Patiently Tracking SIPI Will Make You a Shrewd Buyer (Part 1)

In this, the first in a four part series covering strategy you can use to best maximize your position as a buyer in a down market, the overall SIPI watching proposition is presented as well as analysis of home sales.

"With many potential buyers on the sidelines right now, we believe there is growing pent-up demand that will come into the market once buyer sentiment improves."

Robert Toll, CEO Toll Brothers Home Builders

Many potential home buyers have been on the sidelines, some ‘kicking the tires,’ but mostly waiting for sellers to compromise on prices and terms,

David Lereah, Chief Economist of the National Association of Realtors

"Many potential buyers now are waiting on the sidelines to see how the market shakes out before proceeding with a home purchase."

David Seiders, Chief Economist of the National Association of Home Builders.

Bernanke admitted it is "very difficult to tell" how far the correction will go as buyers appear to be "sitting on the sidelines."

Ben Bernanke, Federal Reserve Chairman


Whether it’s recited with the tired enthusiasm of a washed up salesman or simply repeated over and over again as a mantra during an episode in fetal position, the statement “the buyers are on the sidelines” and the firm belief that they are just waiting to “jump” back into the market seems to put the minds of some in the real estate industry at ease.

Interesting how the very same real estate insiders love to argue that the housing market is NOT like the stock market when it come to homeowners selling their properties but when predicting the future of buying they present a bullish Jim Cramer-esc “Buy Buy Buy!” scenario.

Certainly, there must be at least some truth to this belief, albeit somewhat less now since federal regulators started prodding the lending industry into tightening up on their “sloppy” standards thus restricting many millions of people who, during the run-up days, would have otherwise had carte blanch over borrowing.

Yet, is it really reasonable to suggest that buyers, all across the nation, are simply biding their time watching and plotting, all the while ready to spring into action at the nearest suggestion that the housing market is back on track?

Though we’ll probably never really know the answer to that one, it does seem sensible, at the very least, to develop a basic strategy for determining when to buy or conversely how long to “hold out” during the downturn.

The main point to come away with is that a buyers market demands an astute buyer.

Remember, the market is weakening, and with a reasonable measure of planning, a shrewd buyer will not only insure themselves against buying a dramatically depreciating asset, they will also maximize their purchasing power while still staying within the bounds of their risk tolerance and personal requirements.

In developing this strategy, let’s consider four basic points of interest every buyer MUST draw on in order to make the best of their position in a buyer’s market; they are sales, inventory, prices and interest rates or to coin a new acronym “SIPI”.

Throughout this series, we will be building up an Excel spreadsheet that will capture the SIPI analysis and when complete, should serve as a powerful tool for performing ongoing analysis in the future.

In this, the first of the four part series, let’s focus exclusively on home sales data.

Interpreting Home Sales

Home sales are a direct measure of buyer activity and a good approximation of buyer confidence and enthusiasm. Simply stated, if home sales are on the rise, buyers are buying in greater numbers, or by contrast, if home sales are slowing, buyers are buying less.

Also, home sales are a leading indicator as you should normally see an increasing number of home sales prior to price increases and decreasing home sales prior to prices falling.

Of course, home sales alone don’t give the full picture as many factors could be influencing home sales numbers and inevitably home prices but suffice it to say that if the number of home sales in any given market is declining, there is much less chance that home prices will be appreciating measurably thus no real impetus to “jump” in to the market in order to avoid being priced out..

In order to keep track of home sales in your area, first locate your local association of Realtors website from this list published by the National Association of Realtors.

They generally publish a monthly report on MLS listed home sales that includes the change, as a percentage, of sales from one month to the next as well as year-over-year changes.

It’s important to note that because of the seasonal nature of home sales, month-to-month comparisons are a little deceptive, its probably more important to focus on year-over-year comparisons as you are comparing the number of homes sold in the same market, at the exact same time of the year, just one year later.

Let’s look at recent data for Massachusetts as an example of home sales analysis:
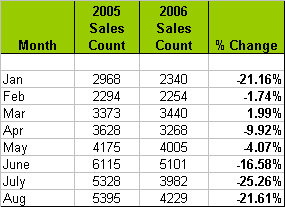


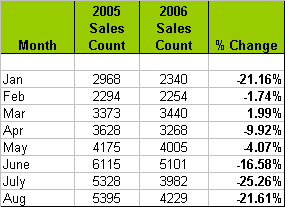
Notice that in the right hand column there are some pretty significant declines to home sales as a monthly year-over-year comparison of 2006 to 2005. As you can see, Massachusetts is currently experiencing a pretty dramatic falloff in home sales and with it has come over a 10% decline in the real median single home price from the peak set in June 2005.

The key here is that if your state looks any bit like ours does, there should be very little chance of home prices appreciating measurably in the near future so a patient buyer can feel confident that by waiting they are NOT risking having home prices get ahead of their budgets.

Remember, the home sales statistics are generally compiled and published as statewide statistics so you will need to keep a vigilant eye on your target market in order to ensure that it is experiencing similar trends.

In the next part of this series, monthly changes to inventory will be incorporated into the picture further filling out the market analysis.

Copyright © 2006
PaperMoney Blog - www.paperdinero.com
All Rights Reserved
Disclaimer